UK Motorparc Data 2021
UK Motorparc Data 2021
Three quarters of a million EVs now on UK roads, but car ownership falls for second year
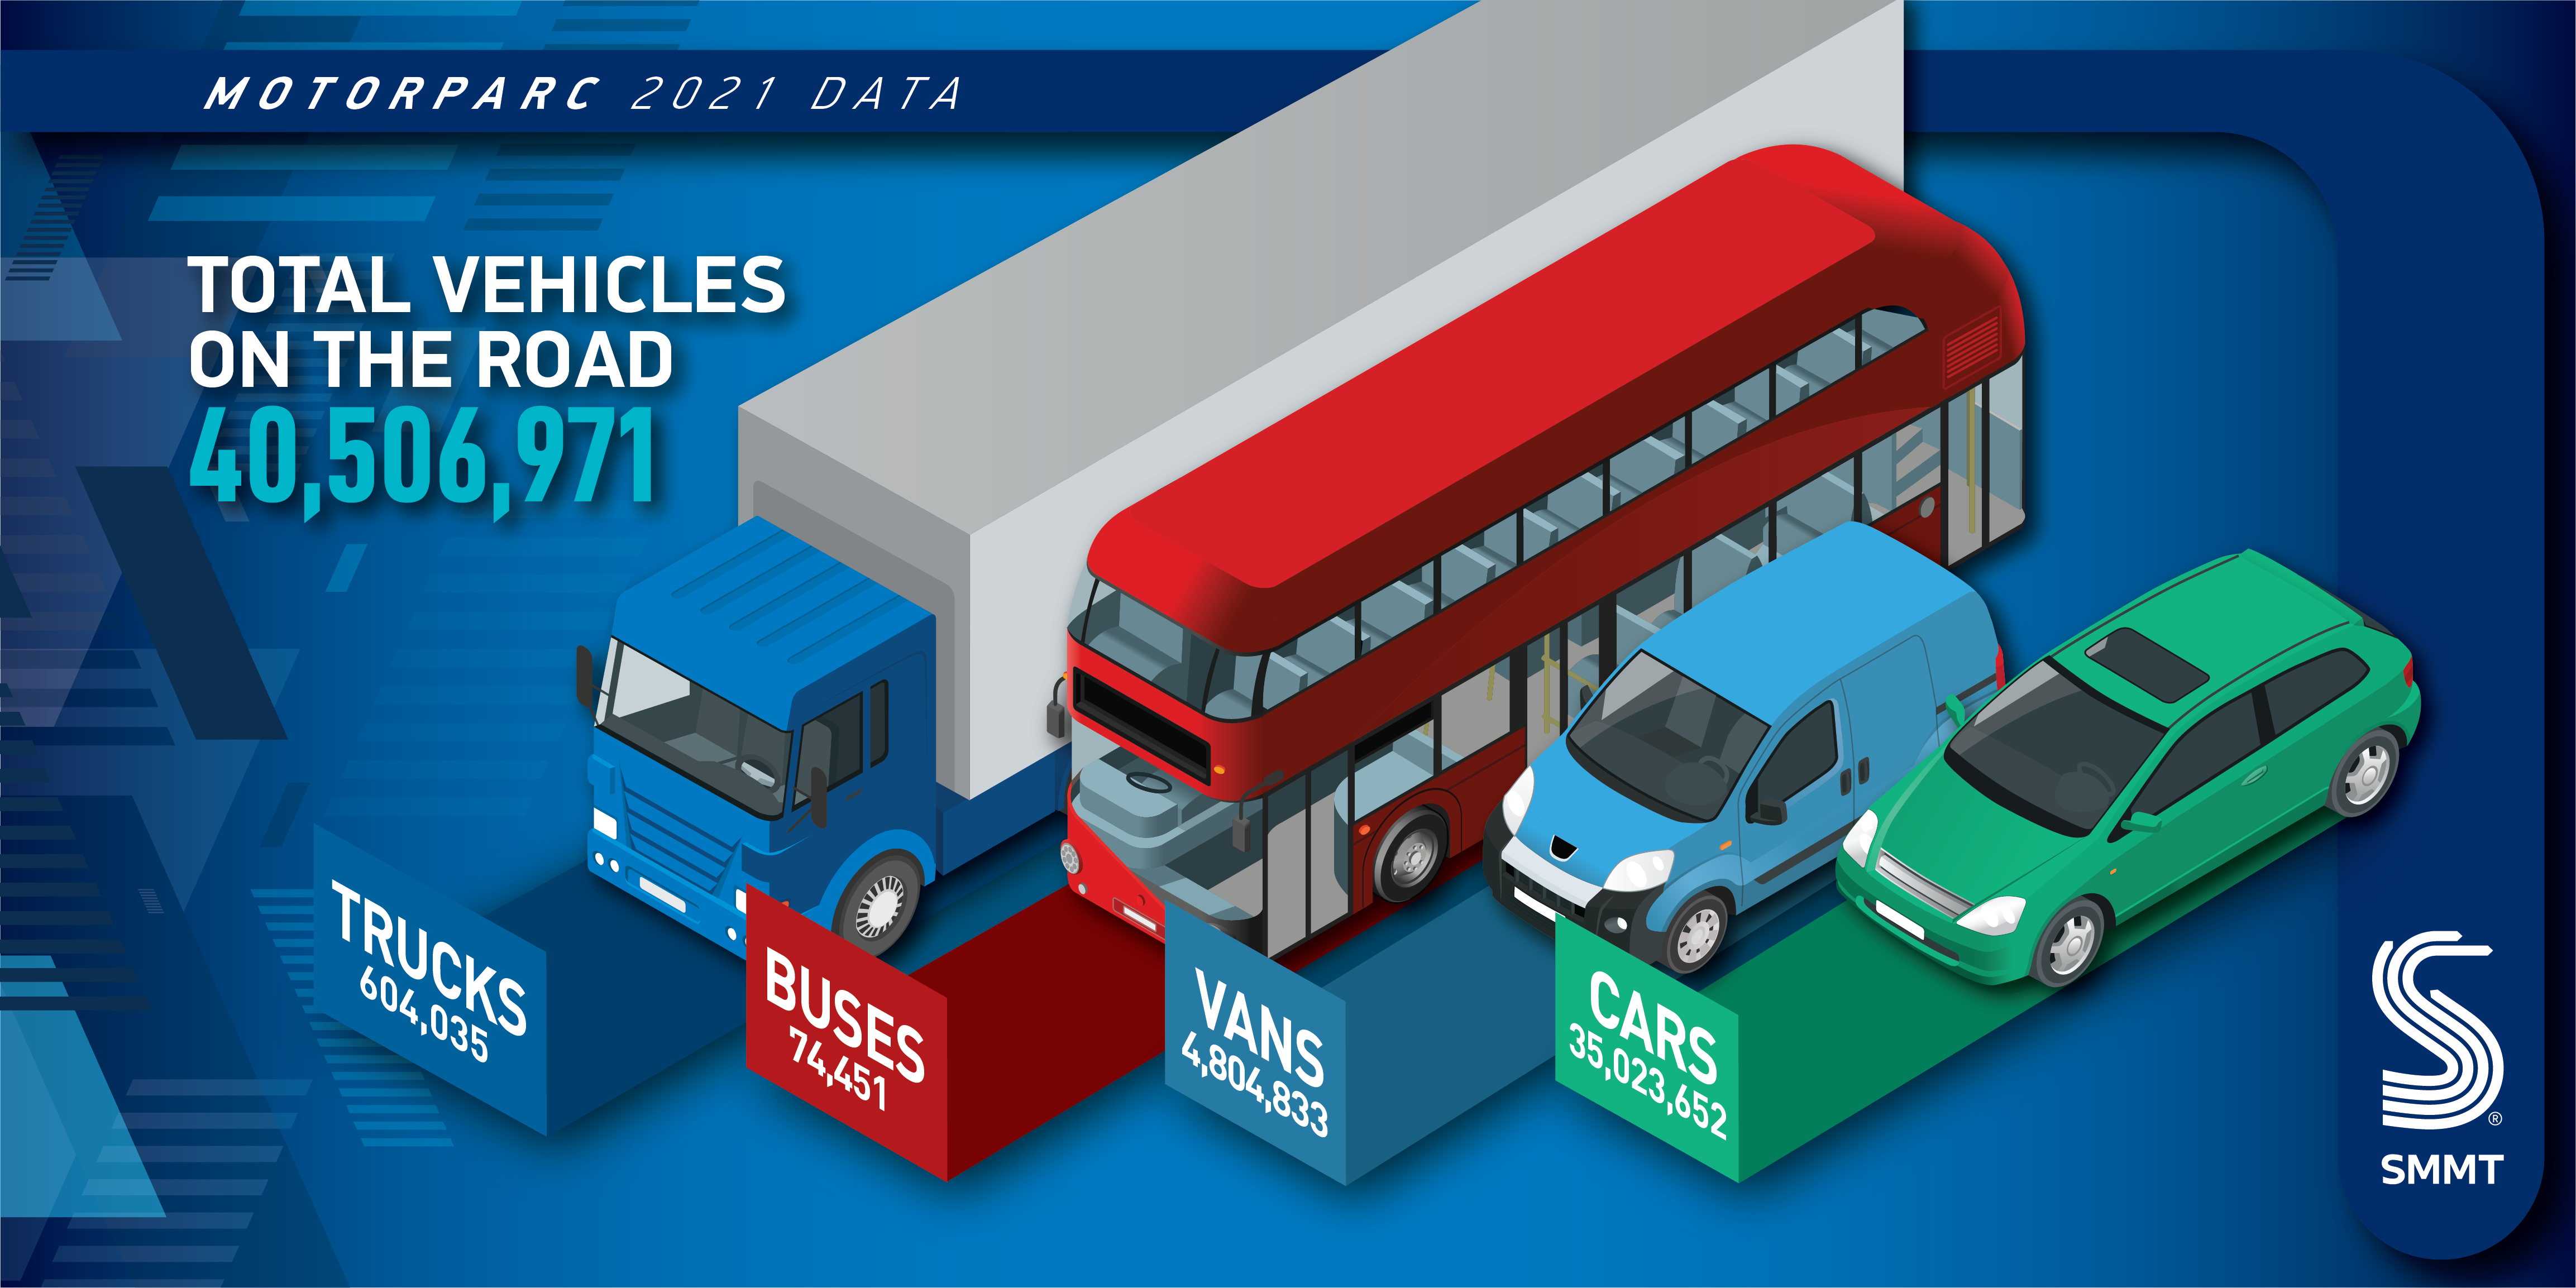
- Vehicles on UK roads increase 0.4% to 40,506,971 in 2021, but car ownership falls -0.2% to 35,023,652 units – the first consecutive annual decrease in car ownership in more than 100 years.
- Electric vehicle use rises by 71% to 748,349 cars, vans, buses and trucks, with growth in all sectors.
- Pandemic-related market disruptions lead Britons to hold on to vehicles for longer, as average car reaches new high of 8.7 years old – more than a year older than a decade ago.
Tuesday 31 May, 2022
The number of vehicles in the UK grew 0.4% to 40,506,971 in 2021, according to new Motorparc data released today by the Society of Motor Manufacturers and Traders (SMMT), with more plug-in electric cars, vans, trucks and buses put on Britain’s roads amid highly challenging pandemic and economic conditions.
Despite the increase in the parc, major shortages of key components and supply chain disruptions across the globe caused new car registrations to remain broadly static at 1.65 million, with car ownership falling -0.2% to 35,023,652 vehicles – the second year in a row the car parc has fallen and the first time the UK has experienced consecutive falls in more than a century.1
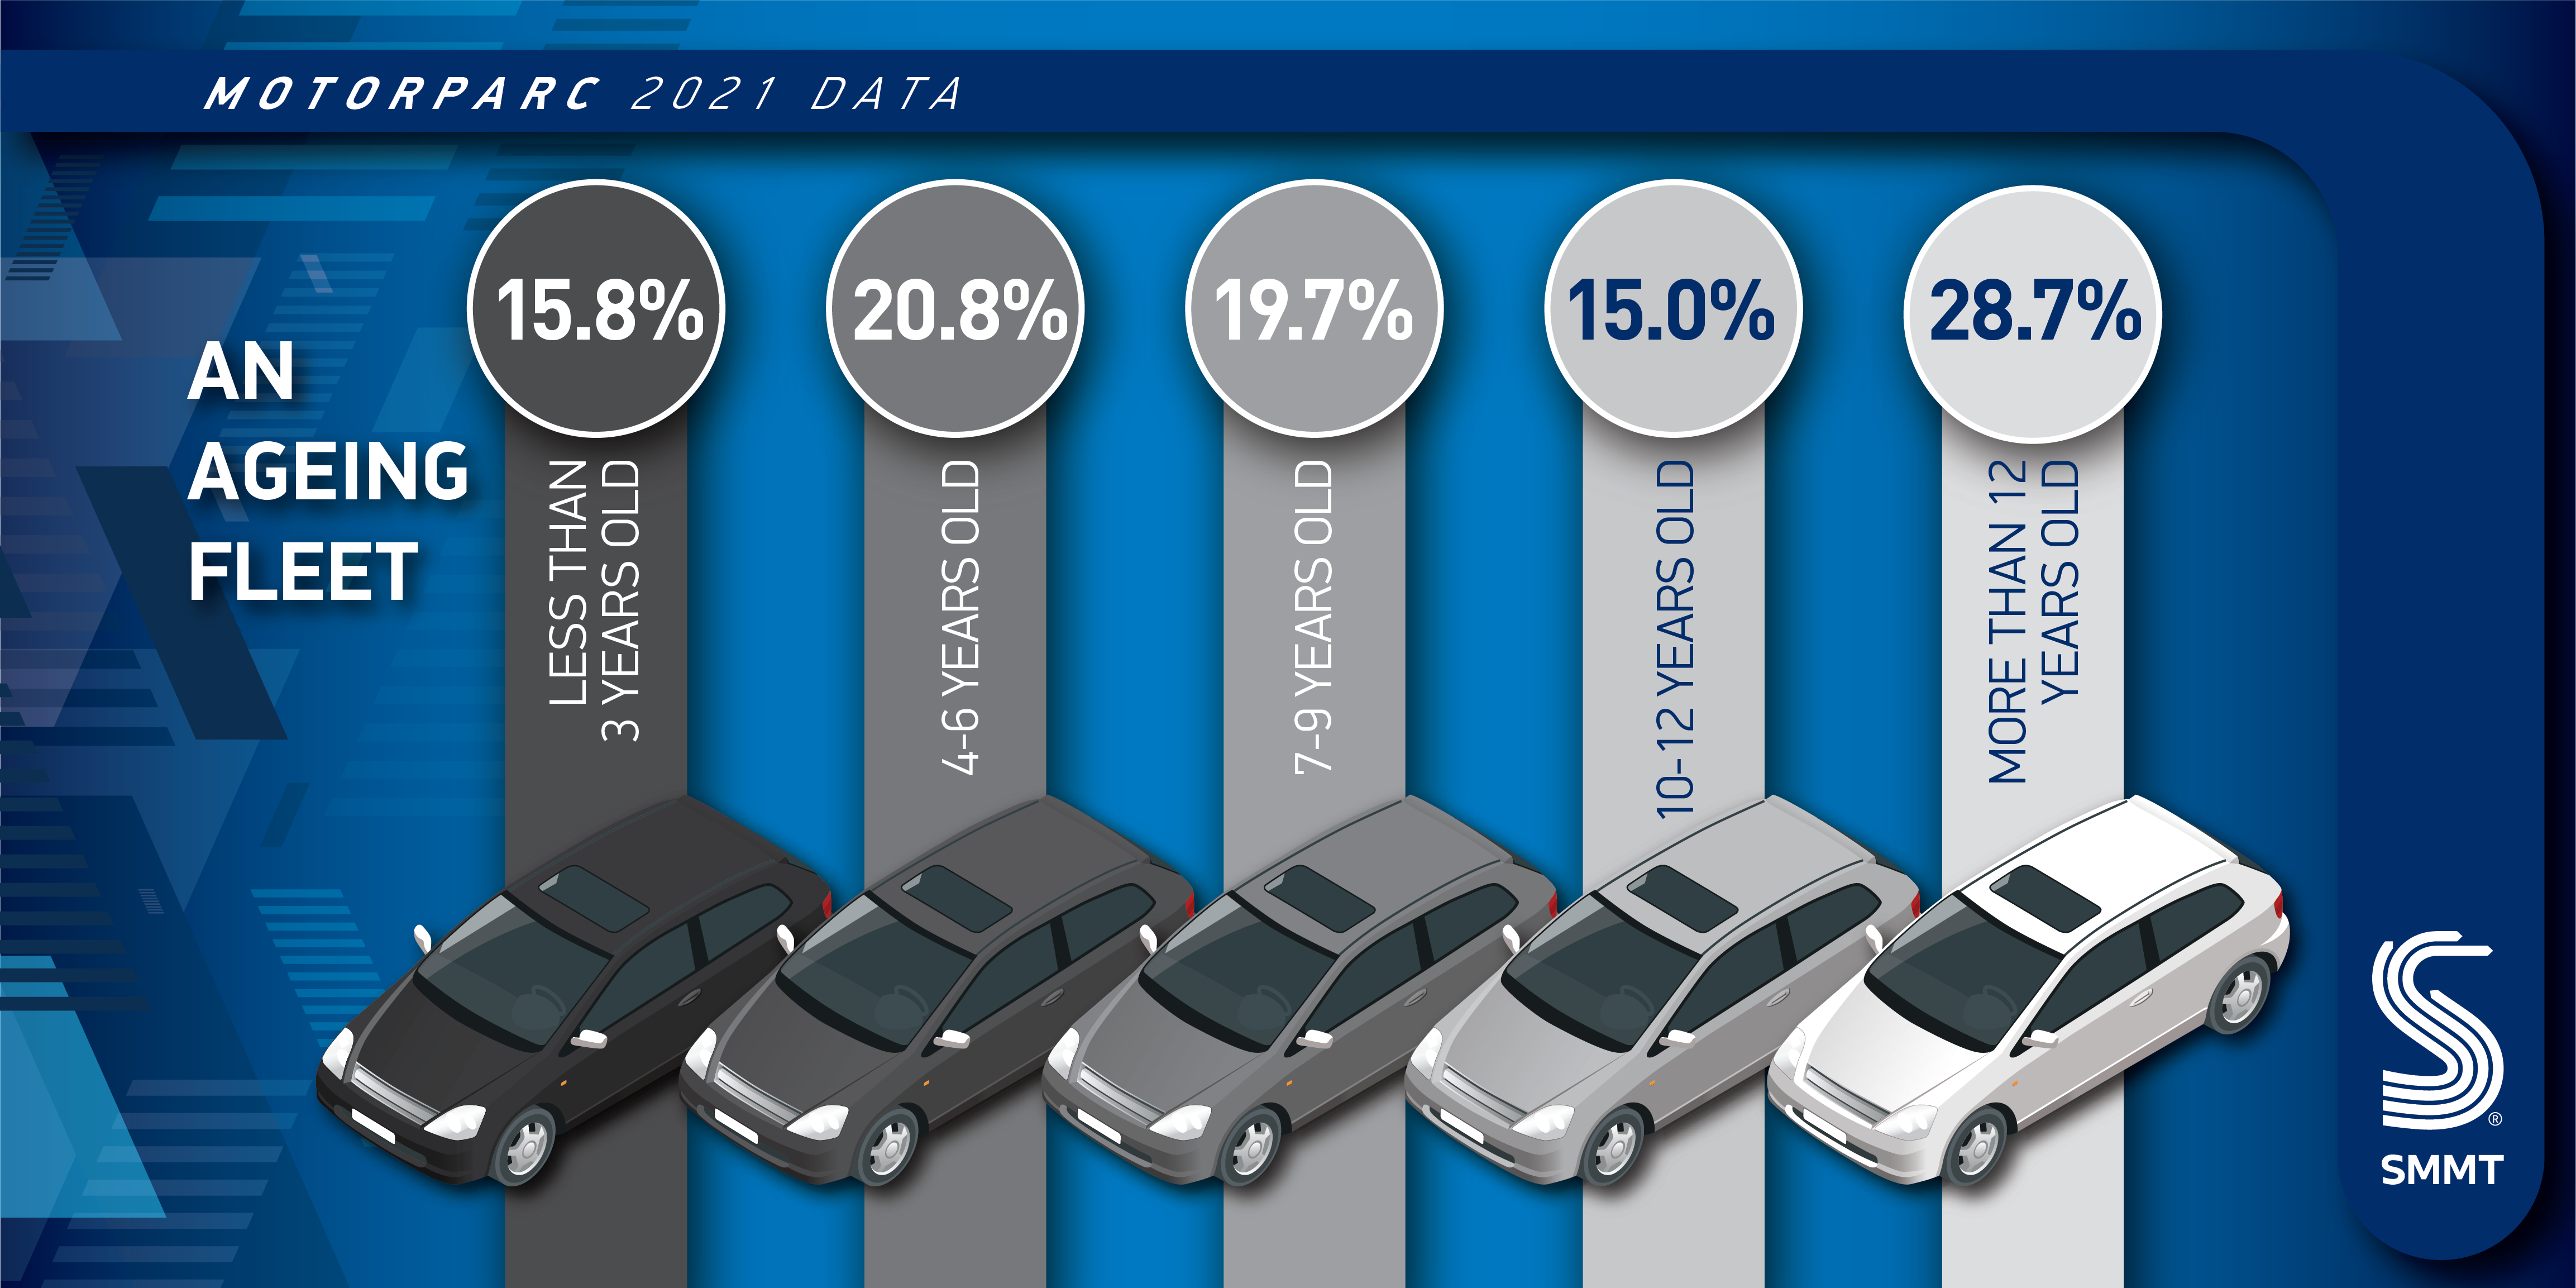
While this is, in part, thanks to more advanced technology and the greater reliability of new vehicles, the main driver has been pandemic-related market issues. Global shortages of key components – most notably semiconductors – have constrained the new car market and the lockdowns of the past two years closed dealerships meaning consumers were less able to buy new cars, instead holding on to their vehicles. This contributed to the average car age reaching a record high of 8.7 years, more than a year older than that a decade ago.2 This means around 8.4 million cars – just under a quarter of those on the road – today are more than 13 years old, having been in service since 2008.
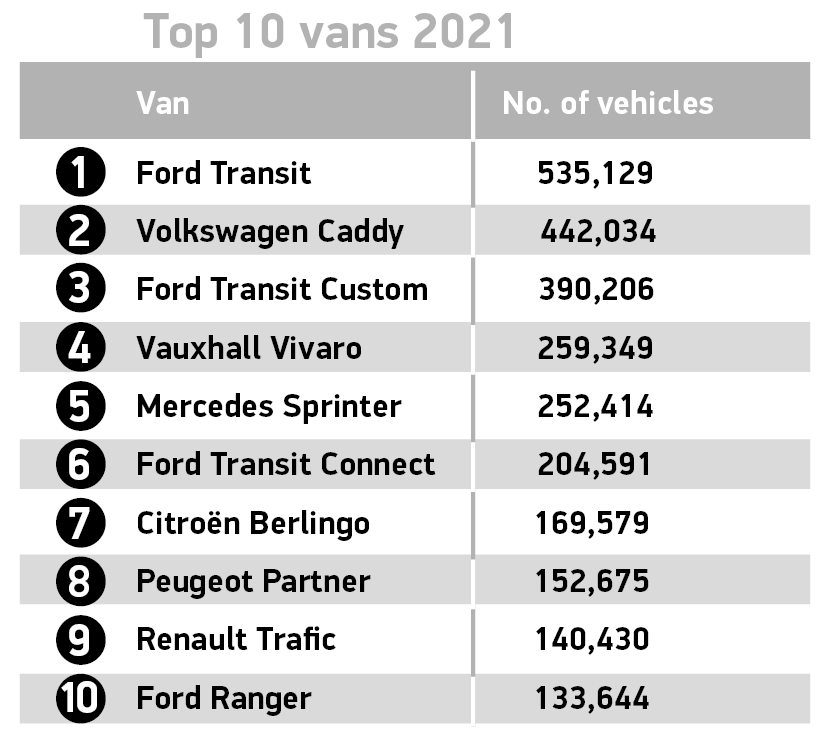
However, a bumper year for light commercial vehicles, which saw the number on the road rise by 4.3% to 4,804,833, contributed to an overall increase in the parc. The heavy goods vehicle sector, meanwhile, saw a 2.5% uplift, with 604,035 trucks in Britain making local, national and international deliveries amid increased demand from key sectors.3 A decade of year-on-year decreases in the bus and coach parc ended with 1.1% growth last year to 74,451 units. However, the bus and coach parc remained at the second lowest level since records began in 1994, as lockdowns and pandemic-related changes in passenger behaviour saw reduced services and less demand from operators.
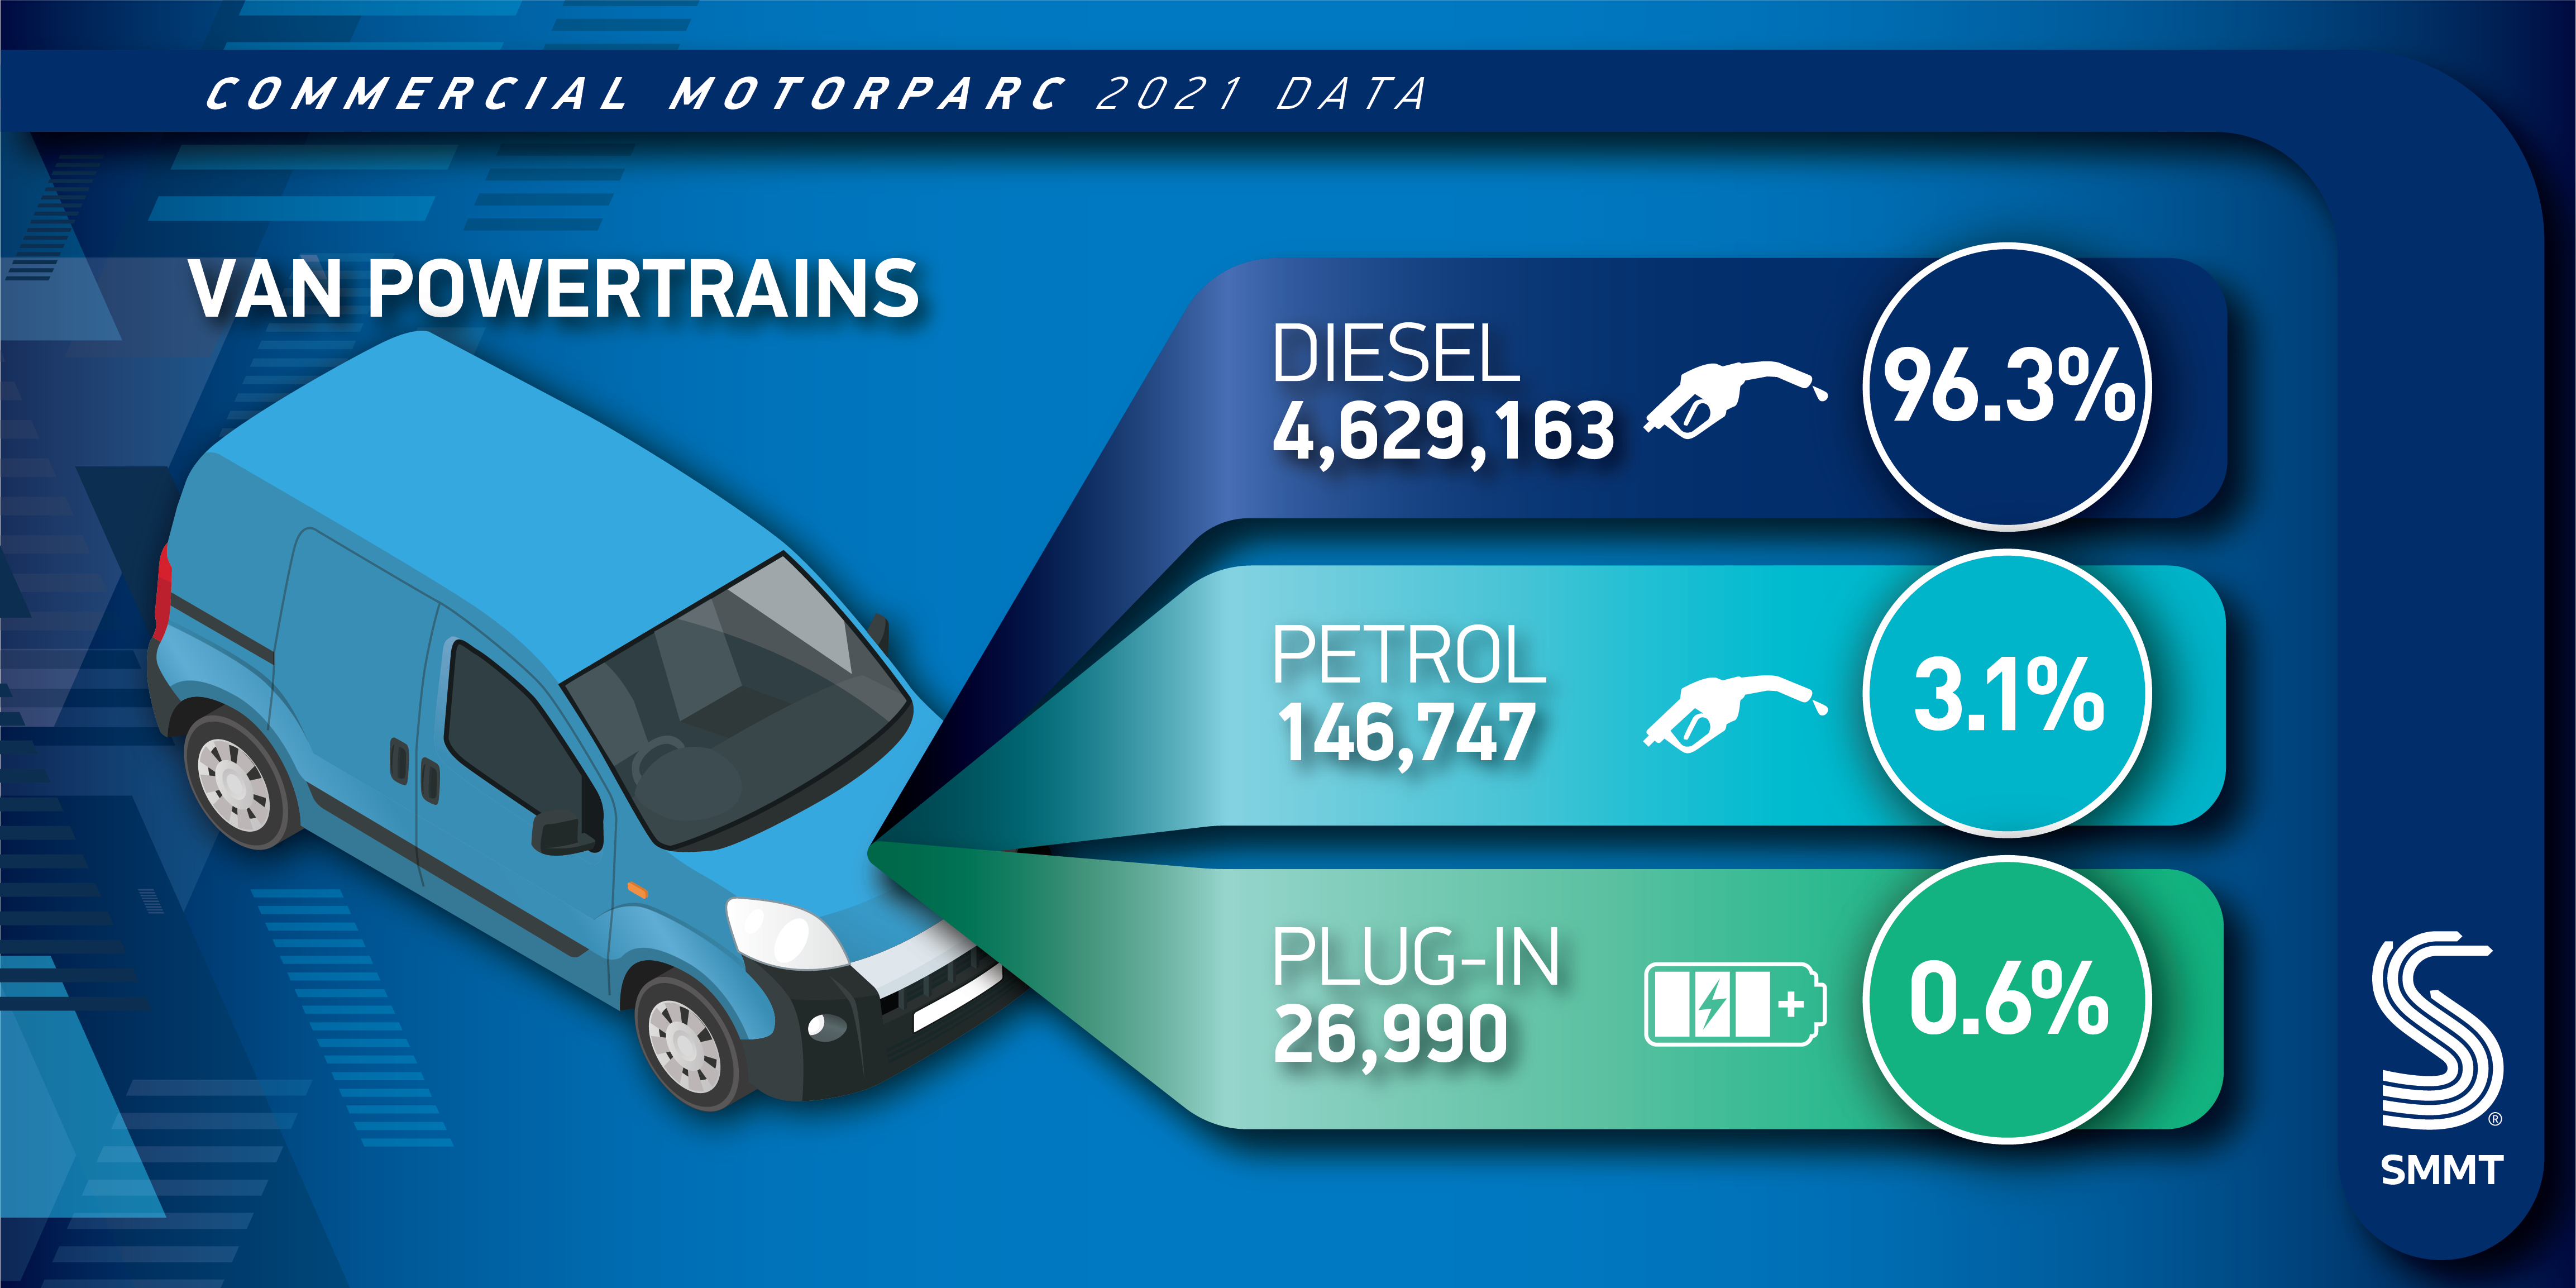
Electric vehicle ownership continues to grow rapidly, as billions of pounds of automotive industry investment in zero-emission cars, vans, trucks, buses and coaches delivers an ever-growing choice of models.4 Nearly three quarters of a million vehicles on the road today can be plugged in, including 720,053 cars, 26,990 vans, 993 buses and 313 trucks.5
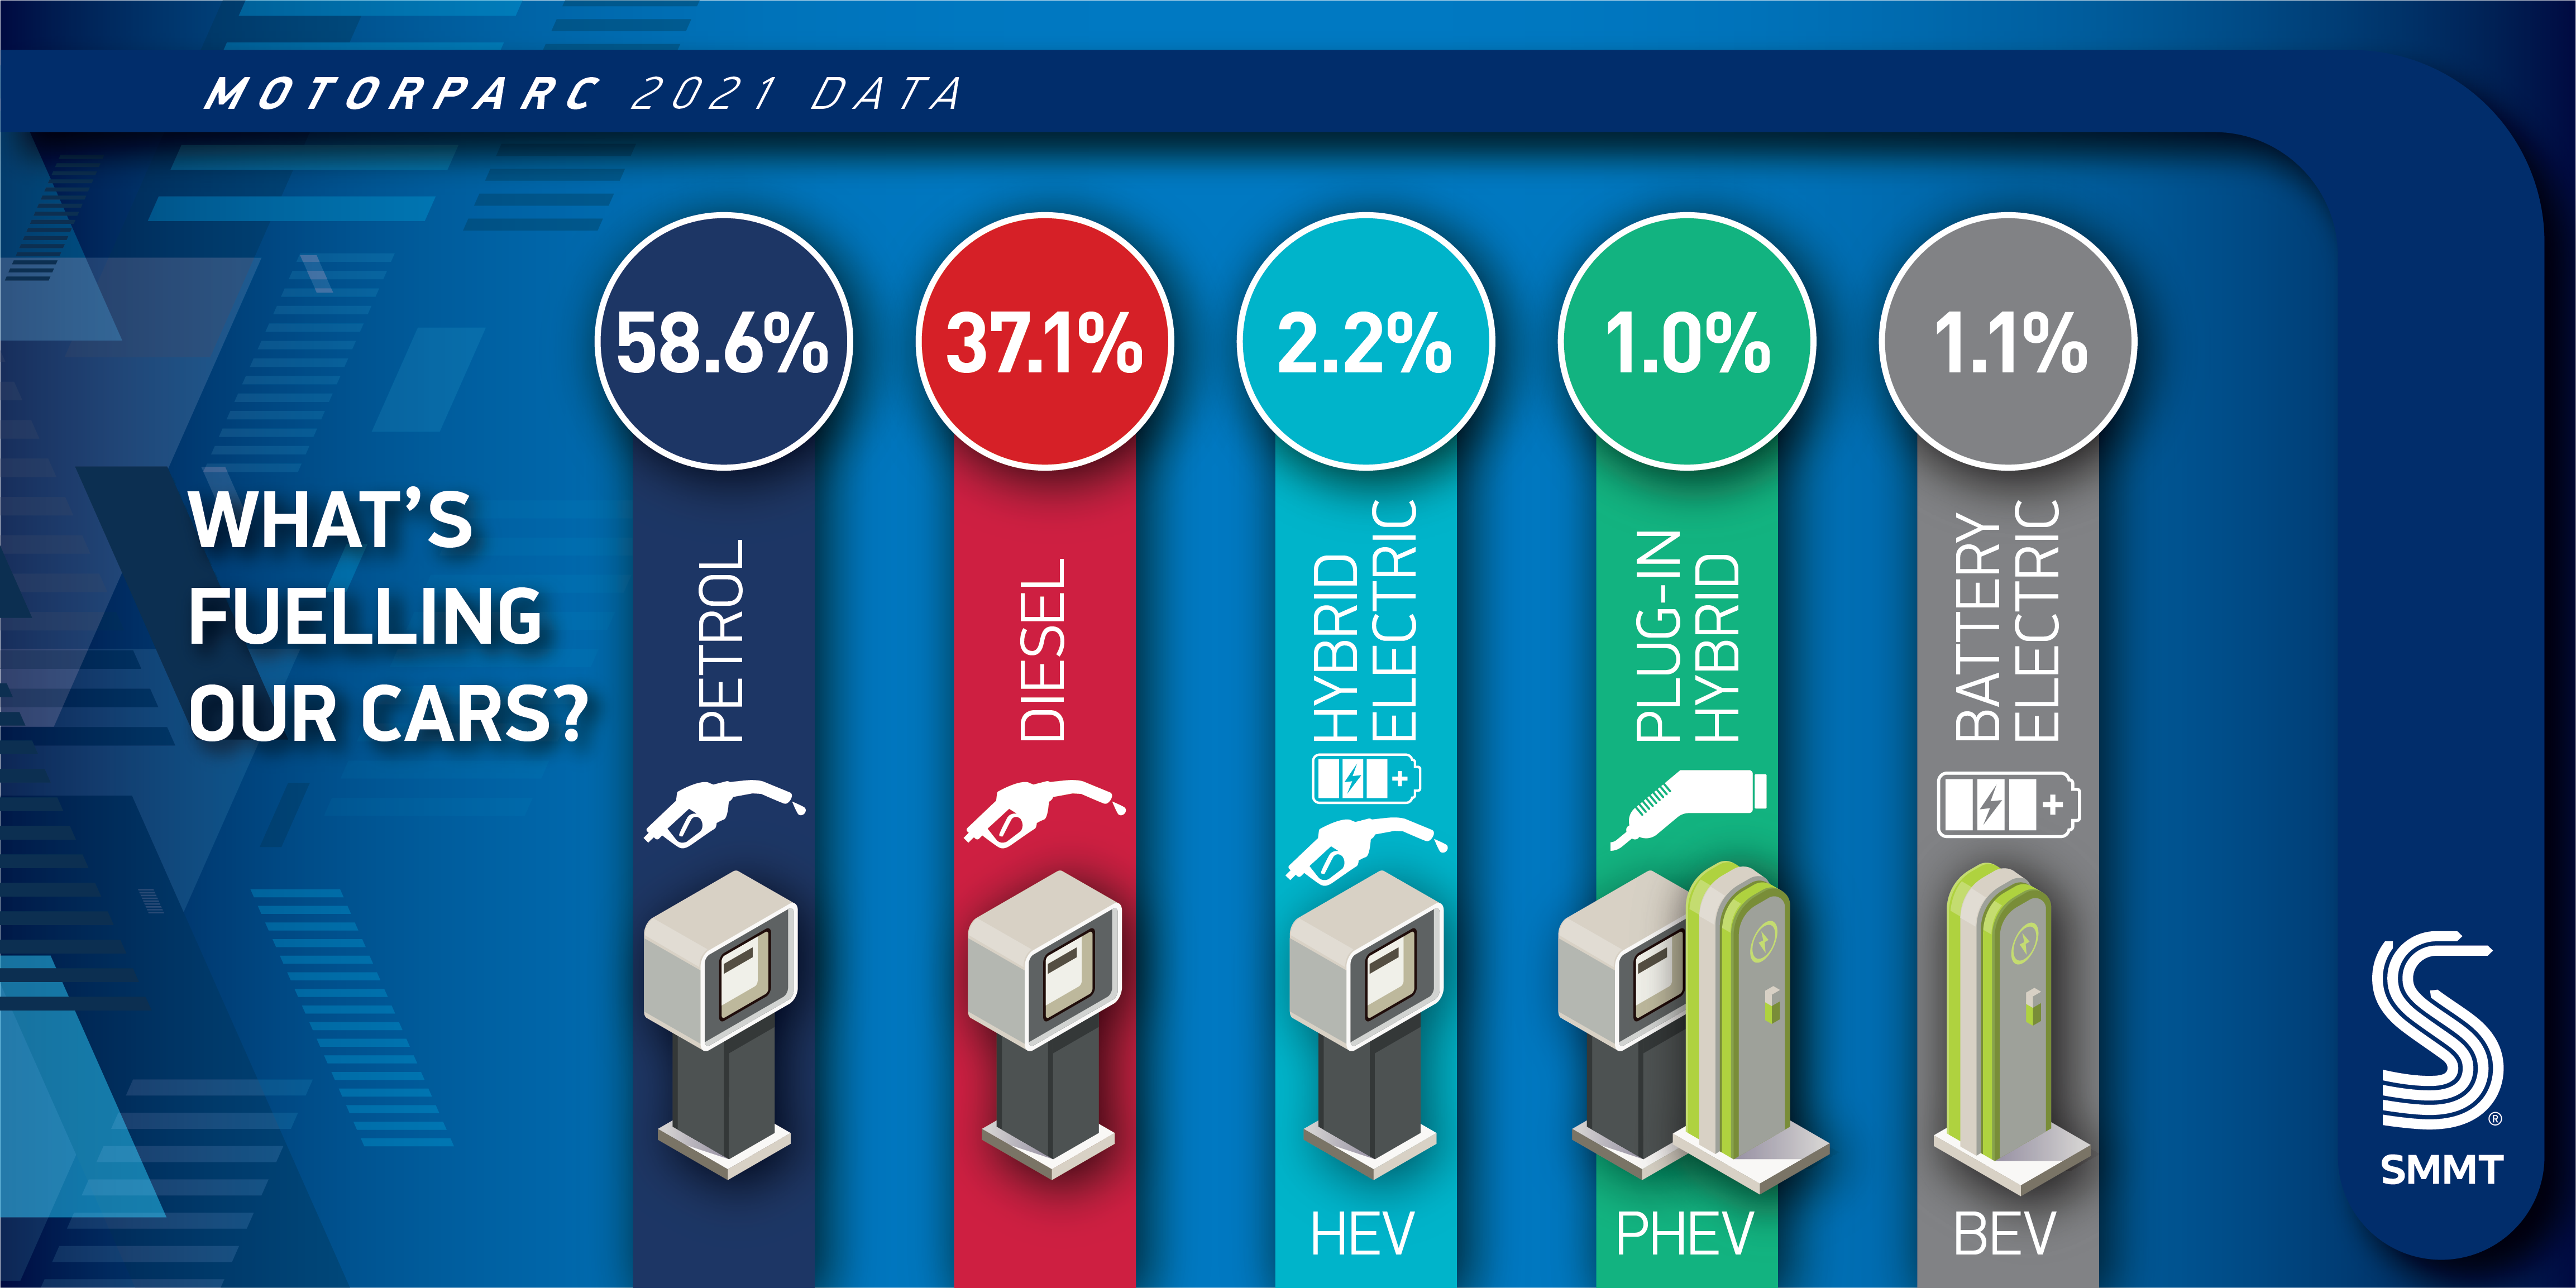
While electric car uptake is growing rapidly, accounting for around one in five new registrations, plug-ins still only represent around one in 50 cars on the road, demonstrating the scale of the challenge ahead in convincing every driver to make the switch. Meanwhile, there are some 20.5 million petrol cars and 13 million diesels making up 58.6% and 37.1% of the car parc respectively, a combined total of 95.7%.
In the commercial vehicle sector, some 0.6% of vans are now plug-in electric, indicating that the van sector is around two years behind that of cars despite both vehicle classes having the same end of sale date for new petrol and diesel registrations.6 Zero-emission public transport is picking up pace, with 1.3% of buses and coaches now battery electric, while electric trucks account for less than 0.1% of the HGV parc, as the development of unique zero-emission technology for these vehicles continues.
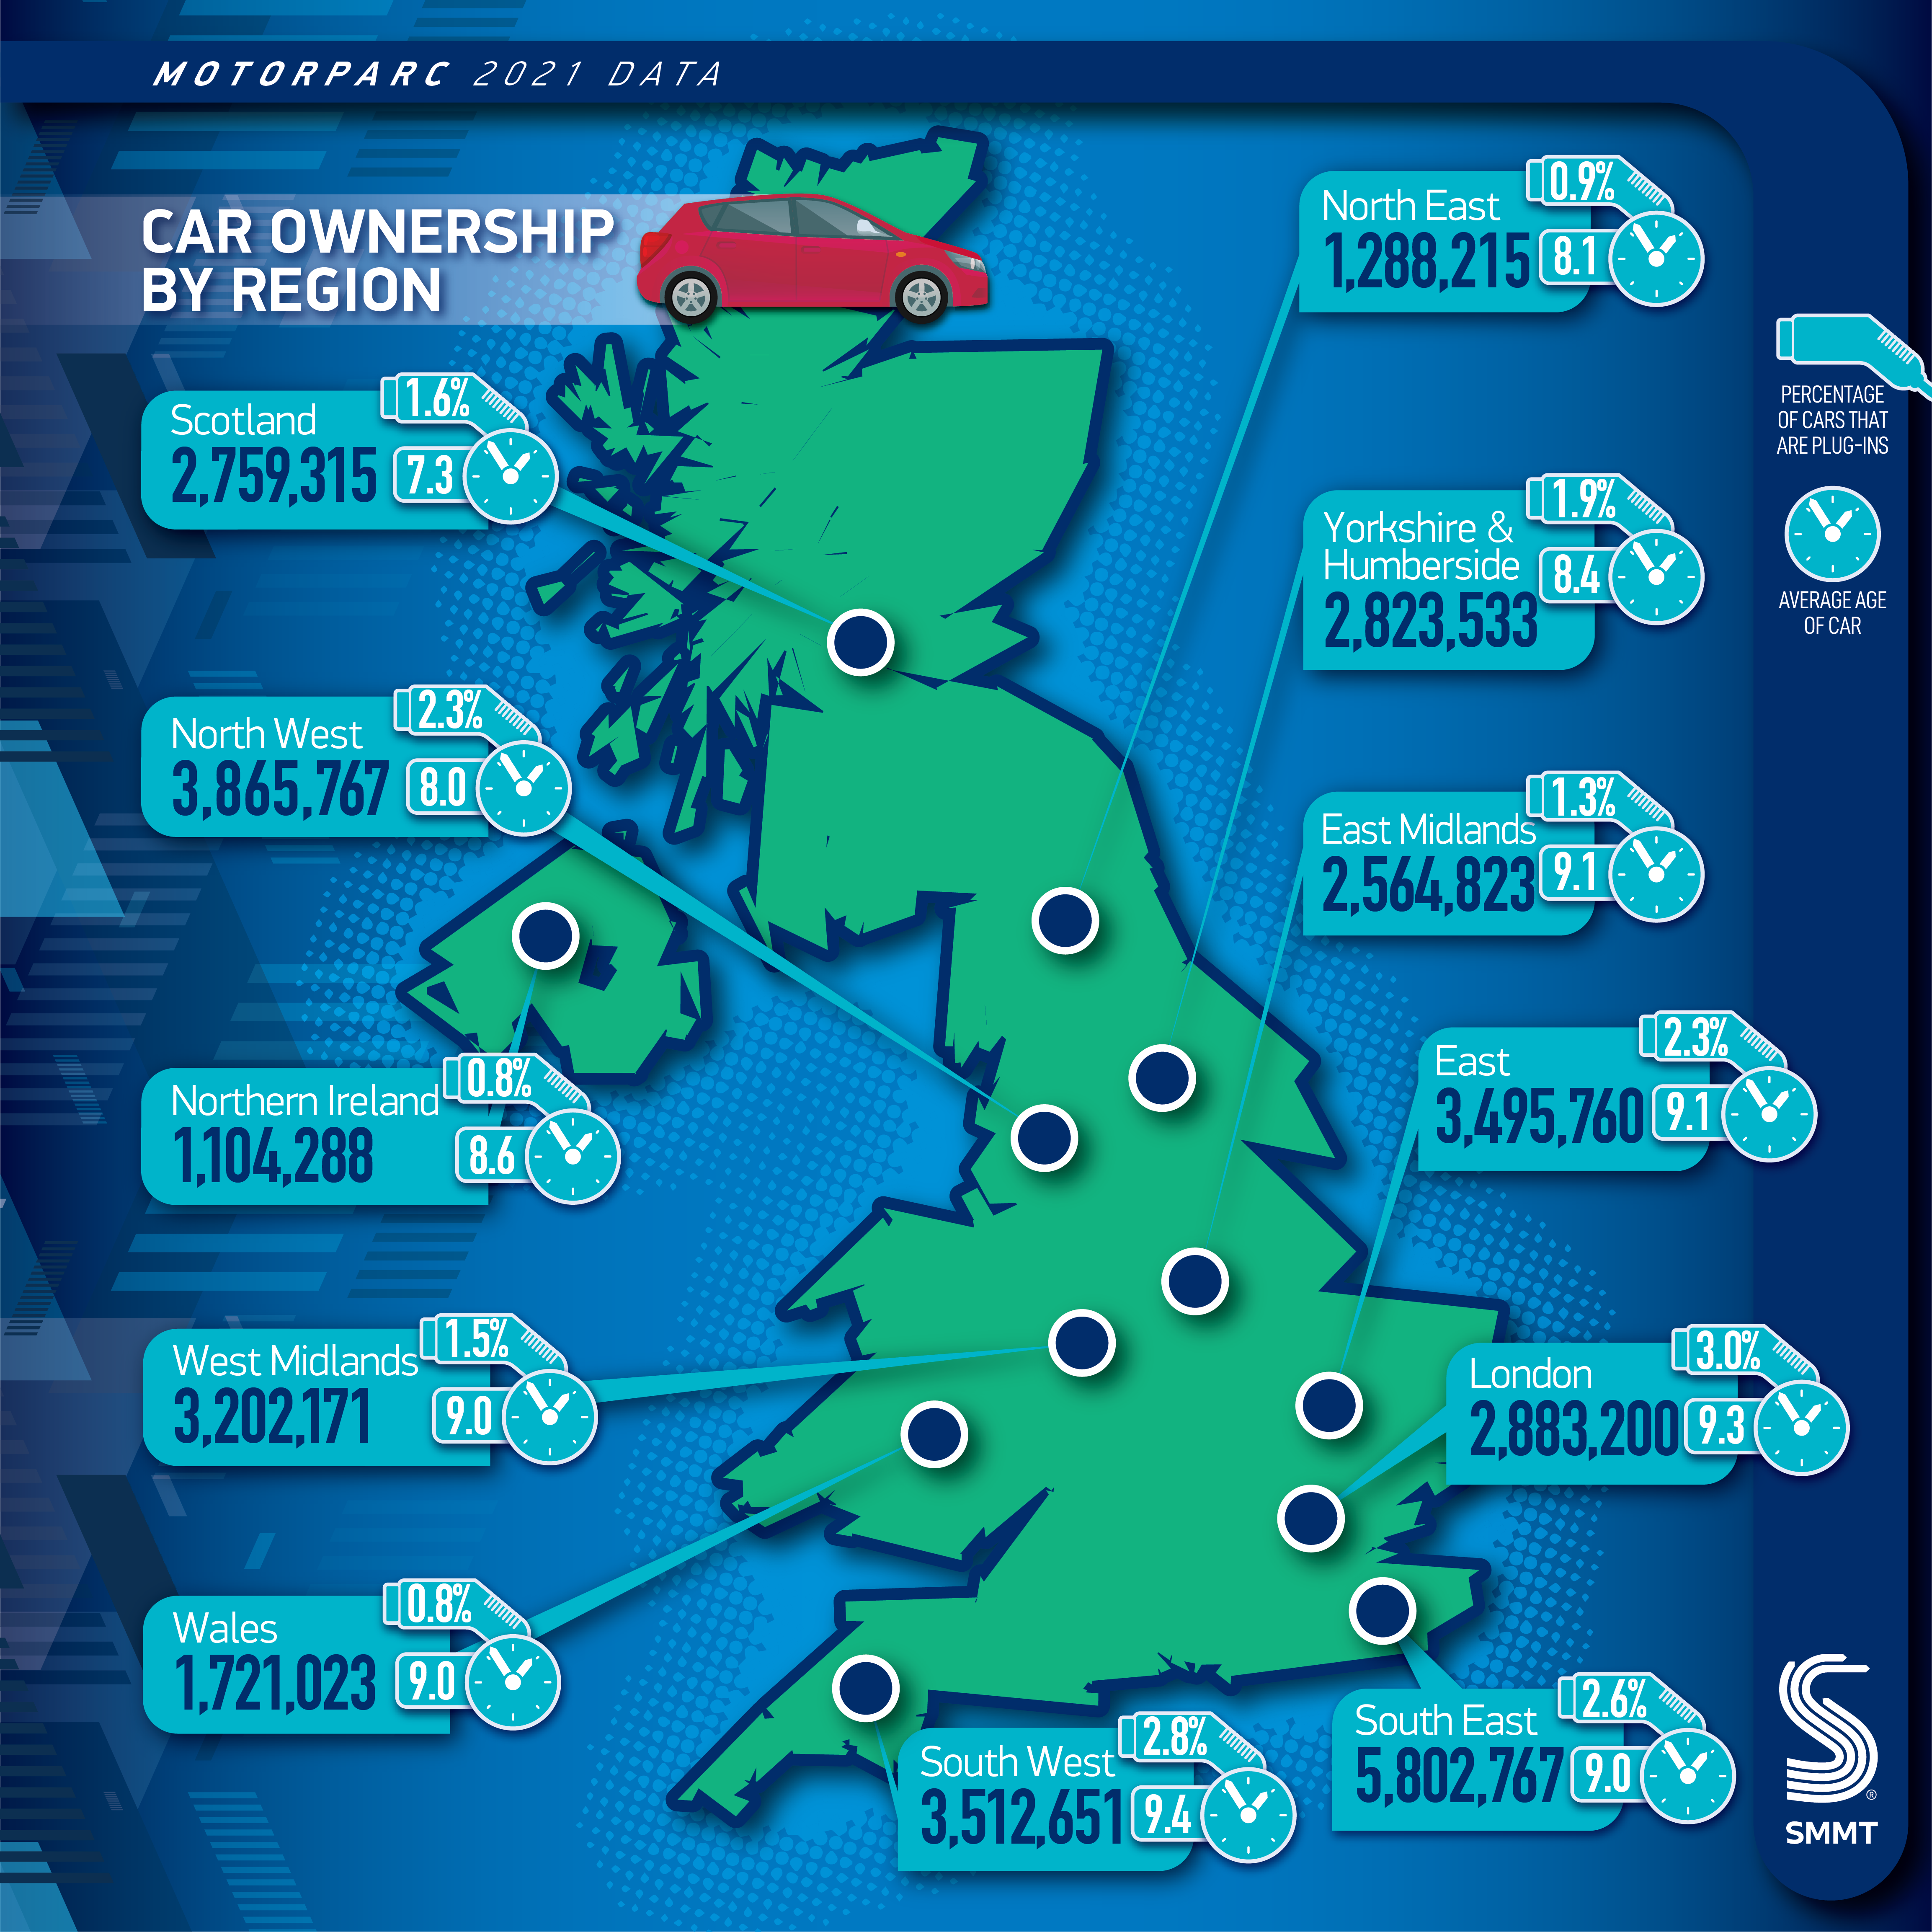
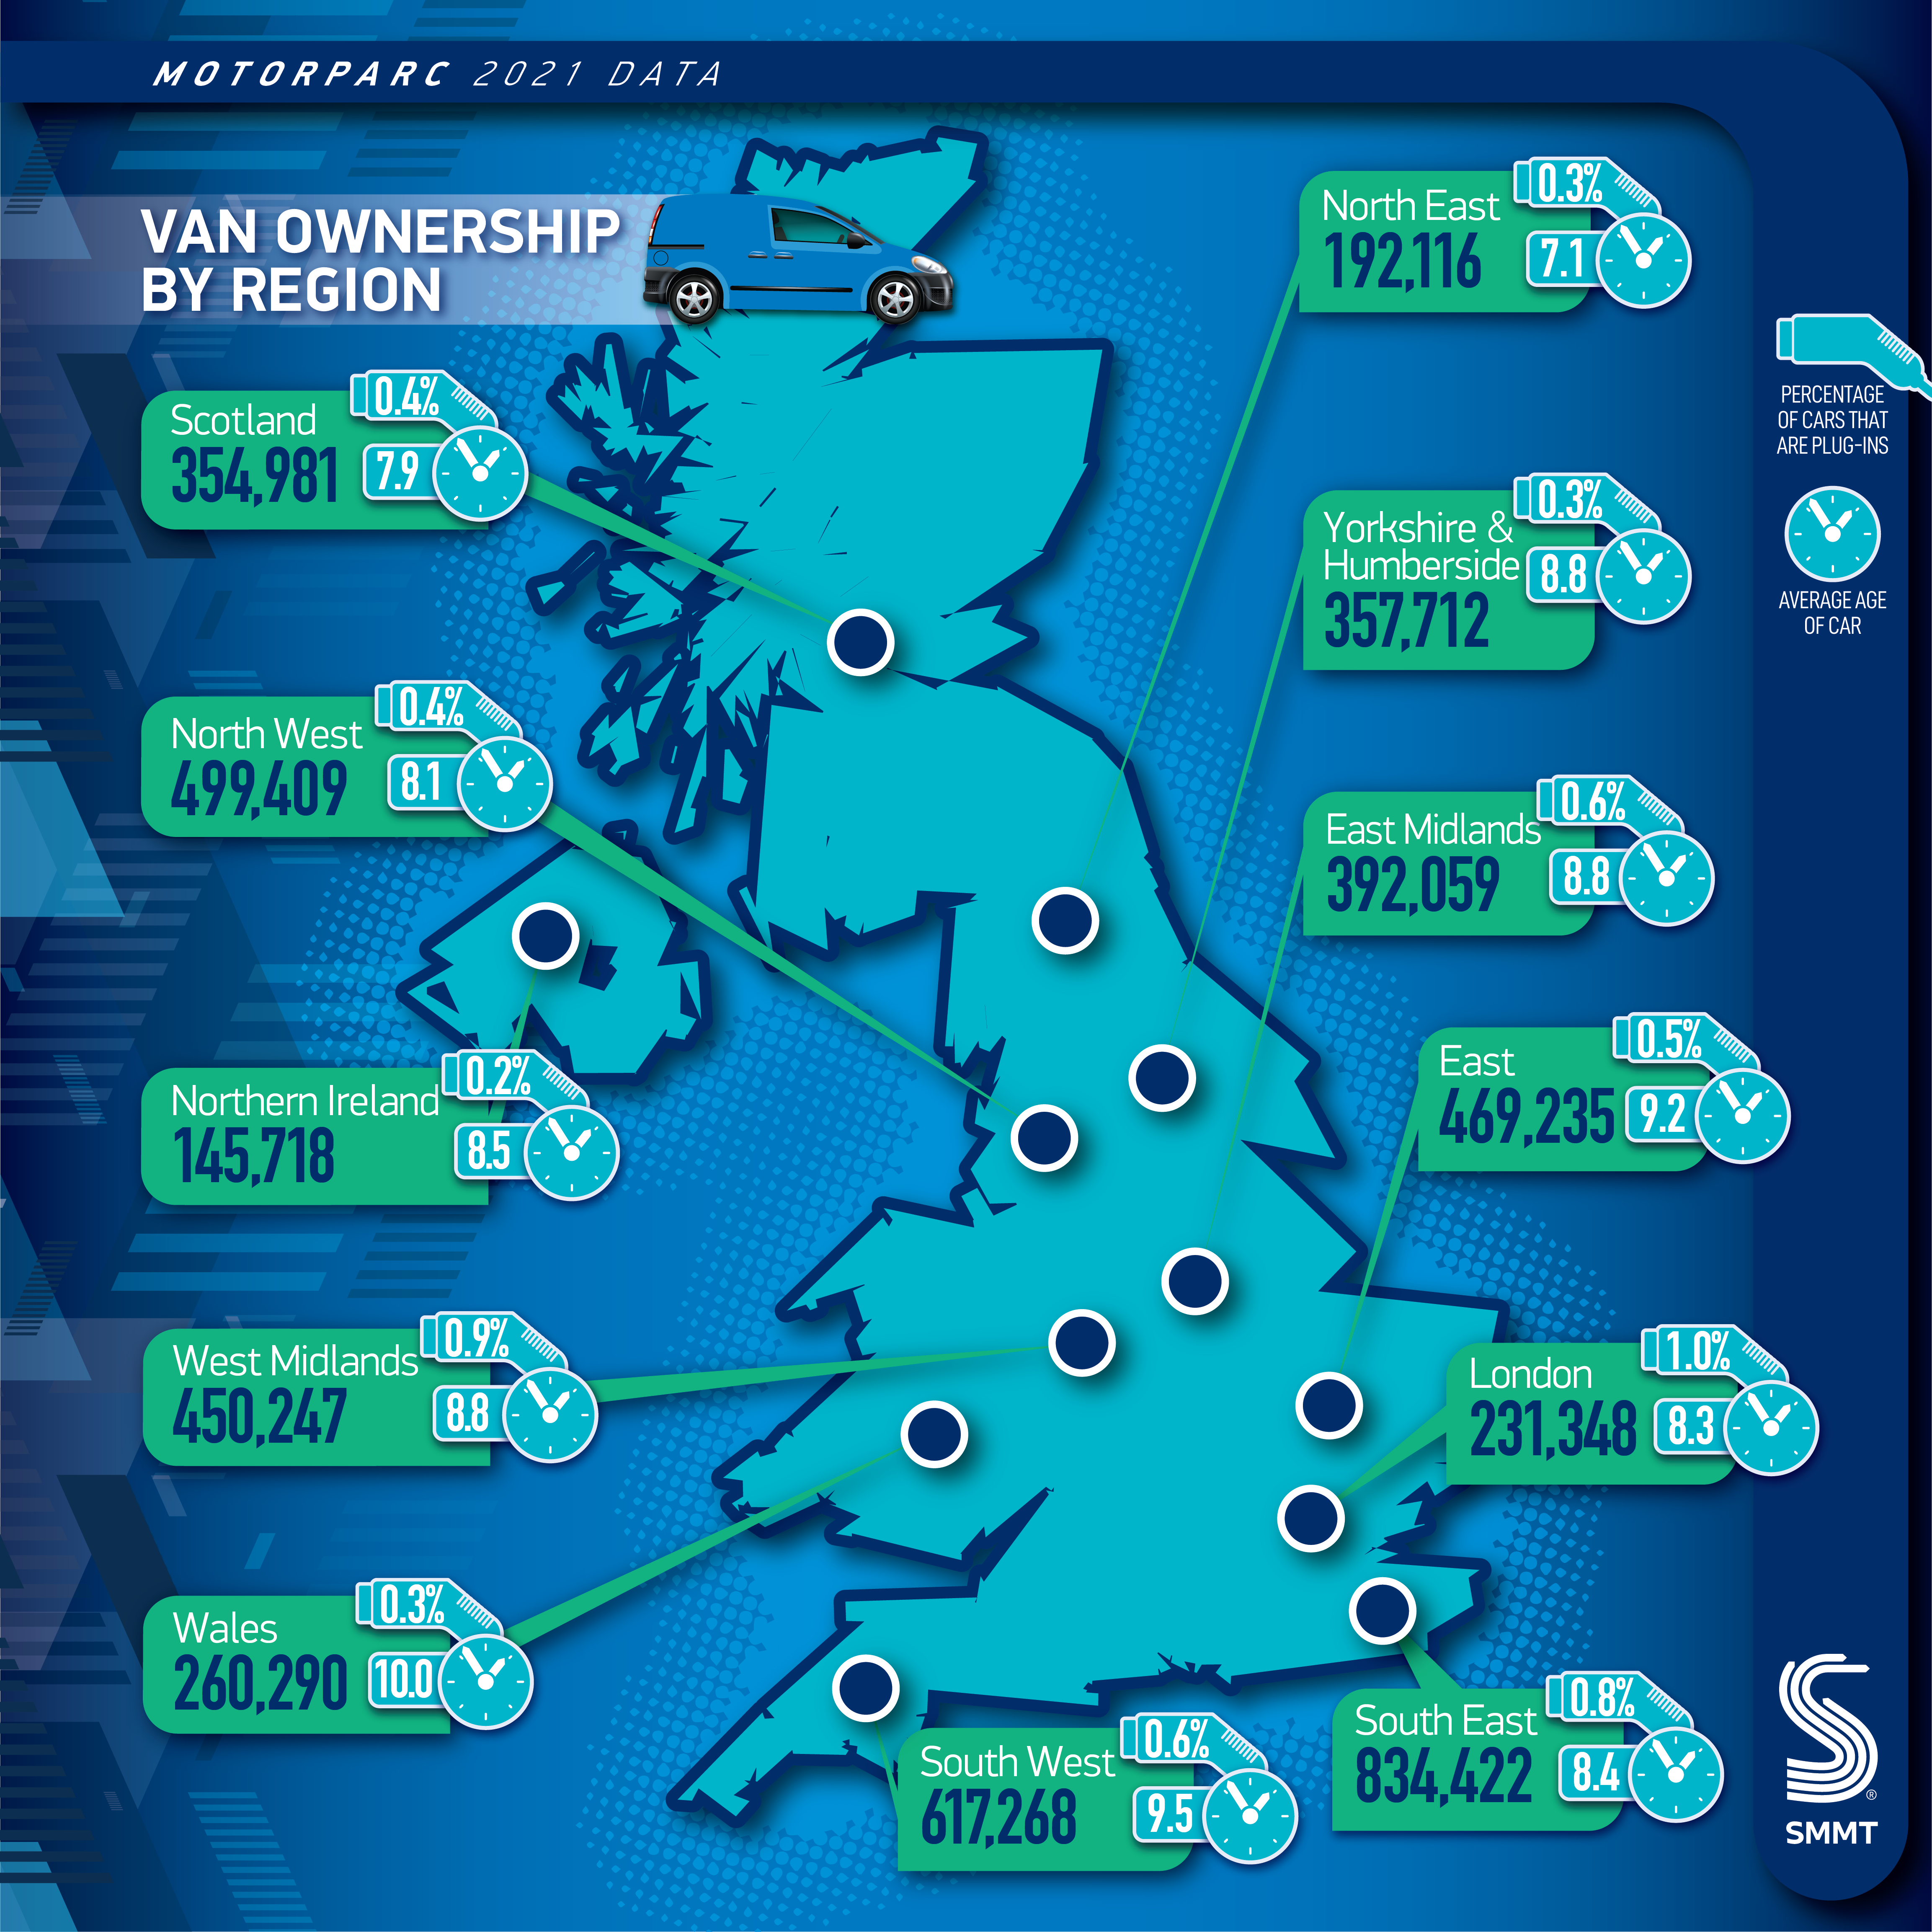
Electric car uptake also varies dramatically across the UK. A third (33.1%) of all plug-in cars are registered in London and the South East, representing 3.0% and 2.6% of all cars in each area. By contrast, 1.5% of cars in the West Midlands are plug-in electric, 1.9% in Yorkshire and Humberside, and 0.9% in the North East. Differences in uptake could also be seen across the four British nations, with plug-ins making up 2.2% of cars in England, 1.6% in Scotland, and 0.8% in Wales and Northern Ireland.
However, the majority of plug-in cars are registered to businesses rather than people, while some 58.8% of all electric cars on the road company registered, reflecting the fact that businesses receive broader, more generous incentives to make the switch than those offered to private consumers.
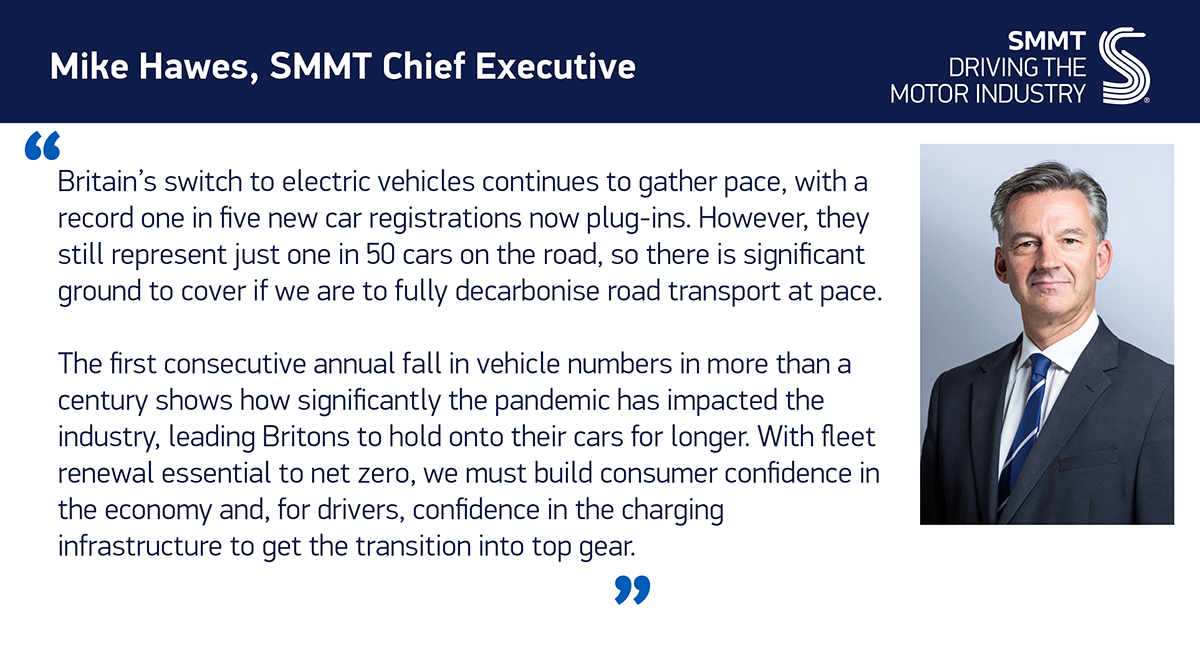
Mike Hawes, SMMT Chief Executive, said:
Britain’s switch to electric vehicles continues to gather pace, with a record one in five new car registrations now plug-ins. However, they still represent just one in 50 cars on the road, so there is significant ground to cover if we are to fully decarbonise road transport at pace.
The first consecutive annual fall in vehicle numbers in more than a century shows how significantly the pandemic has impacted the industry, leading Britons to hold onto their cars for longer. With fleet renewal essential to net zero, we must build consumer confidence in the economy and, for drivers, confidence in the charging infrastructure to get the transition into top gear.
Did you know?
- The total parc has increased by 4.7 million vehicles (+13.3%) since 2012.
- 8,420,961 cars have been in service since 2008 or earlier – 24.1% of the car parc.
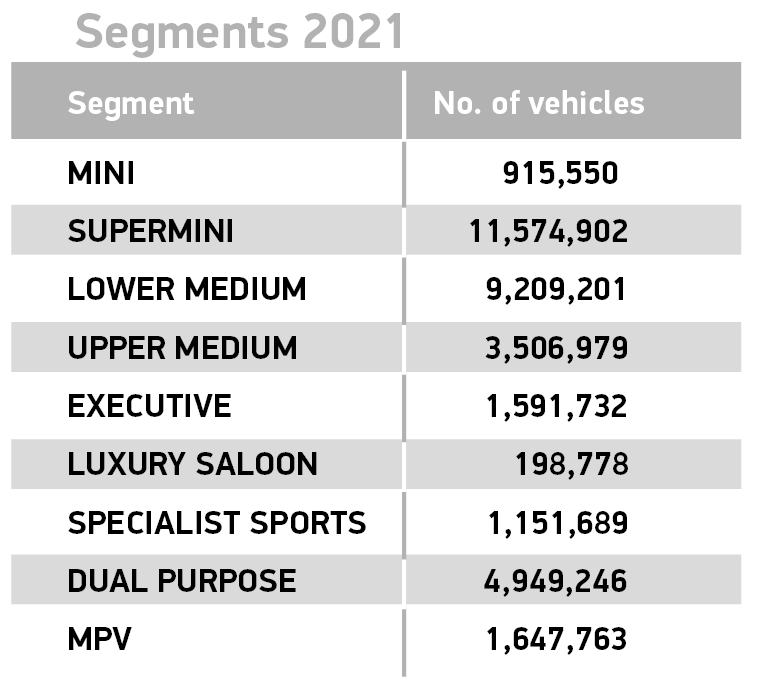
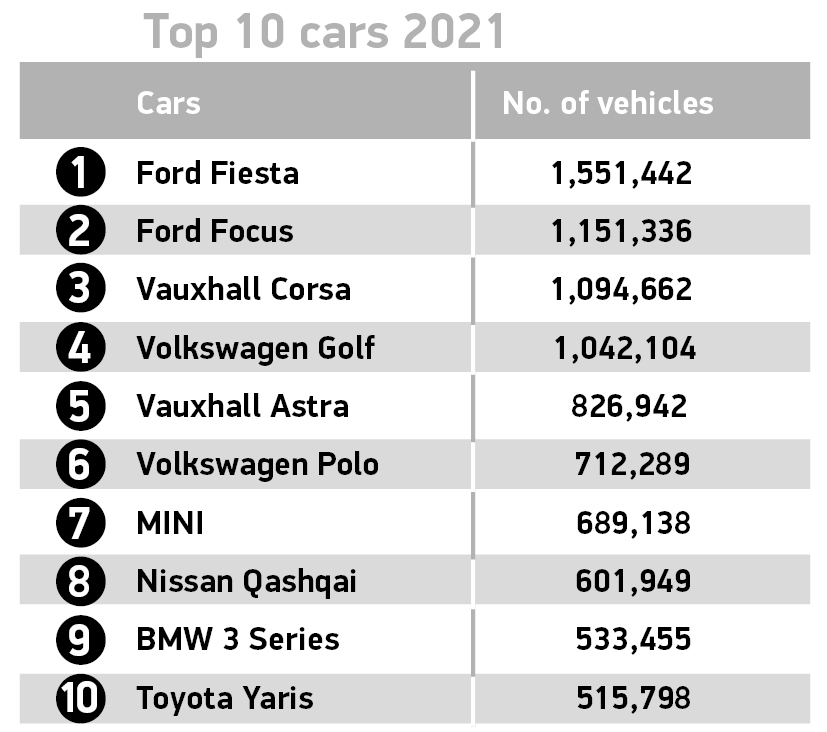
- Britain’s favourite car types are supermini and lower medium car segments, which account for nearly six in 10 cars in service, at 11,574,902 and 9,209,201 units respectively.
- Manual transmission accounted for 68.1% of the car parc.
- 66.6% of all cars on UK roads were made in the EU, while British-built cars account for 15.3%.
- Drivers in London are more likely to own a British car than other UK regions, with 16.8% of cars built in the UK, followed by the East (16.0%) and South East (15.6%).
Notes to Editors
1. The previous recorded consecutive decline was between 1915-18, however, no parc records for the Second World War period are available.
2. The average car in 2021 was 7.6 years old.
3. 2021 van registrations: 62,723 units (+21.4%); HGV registrations: 37,163 (+12.9%).
4. ‘UK Automotive invests £10.8 billion in first “electric decade”’: https://www.smmt.co.uk/2022/03/uk-automotive-invests-10-8-billion-in-first-electric-decade/
5. Plug-in electric powertrains include battery electric, plug-in hybrid petrol, plug-in hybrid diesel, and range extender.
6. ‘Industry calls for chargepoint “van plan” to switch owners to electric’: https://www.smmt.co.uk/2022/05/industry-calls-for-chargepoint-van-plan-to-switch-owners-to-electric/
File Downloads
- Motorparc
Motorparc
| Title | Description | Version | Size | Download |
|---|---|---|---|---|
| Top 10 vans 2021 | 489.92 KB | DownloadPreview | ||
| Top 10 vans 2021 | 302.41 KB | DownloadPreview | ||
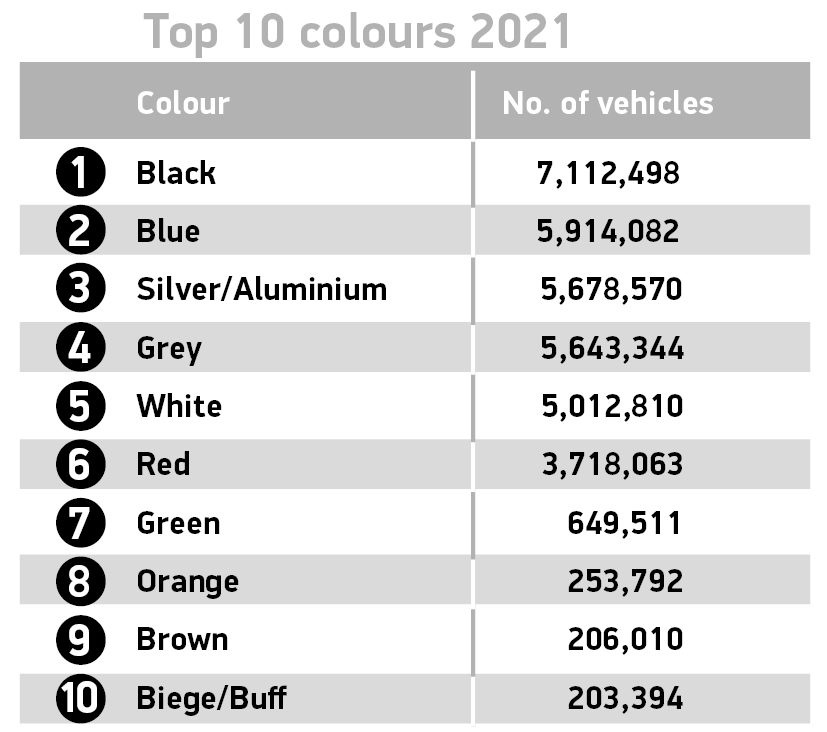
| Top 10 colours 2021 | 268.59 KB | DownloadPreview | ||
| Top 10 colours 2021 | 114.89 KB | DownloadPreview | ||
| Top 10 cars 2021 | 81.21 KB | DownloadPreview | ||
| Top 10 cars 2021 | 56.78 KB | DownloadPreview | ||
| Segments 2021 | 171.83 KB | DownloadPreview | ||
| Segments 2021 | 39.05 KB | DownloadPreview | ||
| Motorparc van powertrains | 1.51 MB | DownloadPreview | ||
| Motorparc total vehicles | 1.79 MB | DownloadPreview | ||
| Motorparc regional map vans | 3.73 MB | DownloadPreview | ||
| Motorparc regional map cars | 3.66 MB | DownloadPreview | ||
| Motorparc fleet age | 1.73 MB | DownloadPreview | ||
| Motorparc car fuel type | 1.29 MB | DownloadPreview | ||
| Motorparc 2021 cars release FINAL_May 2022 | 33.32 KB | Download | ||
| MH motorparc quote | 370.41 KB | DownloadPreview |

Comments are closed.