UK Motorparc Data 2022
UK Motorparc Data 2022
Britain gets back in the driving seat with more than a million EVs on the road
- Number of vehicles on UK roads grows 0.5% to reach record 40.7 million, with car ownership rising for first time since 2019.
- One in every 32 cars now comes with a plug with 1.1 million electric cars now in use, and new technologies cutting average car and van CO2 emissions by -1.6%.
- Record numbers of HGVs and vans in service, but buses fall to all time low with almost 17,000 lost in the last decade.
- Industry urges action on infrastructure and incentives to accelerate zero emission transition.
Tuesday 25 April, 2023
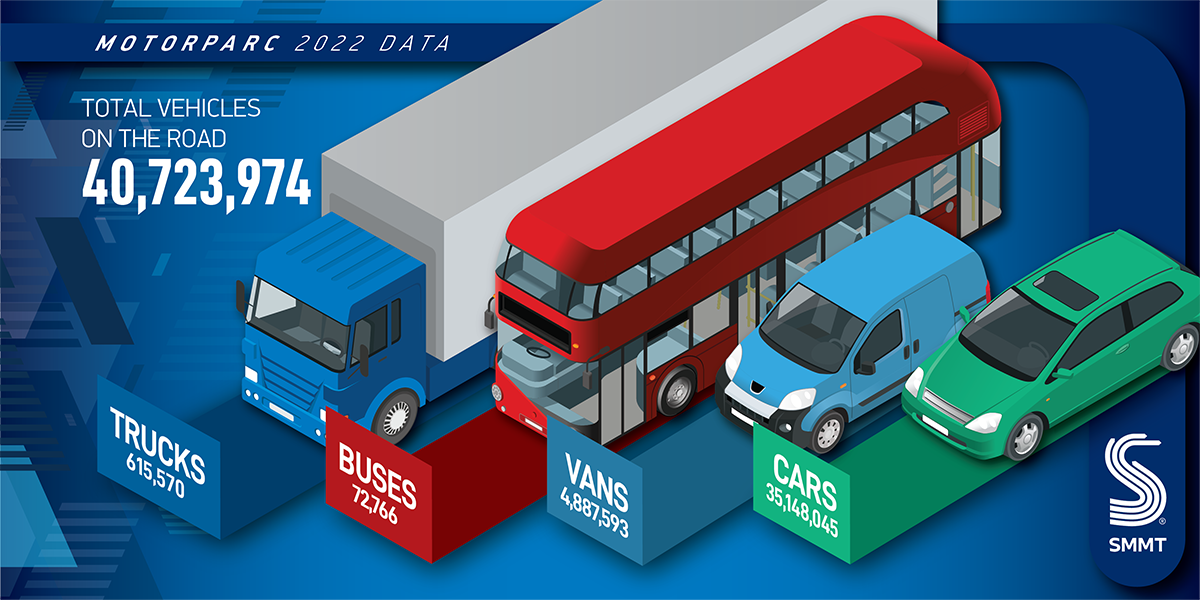
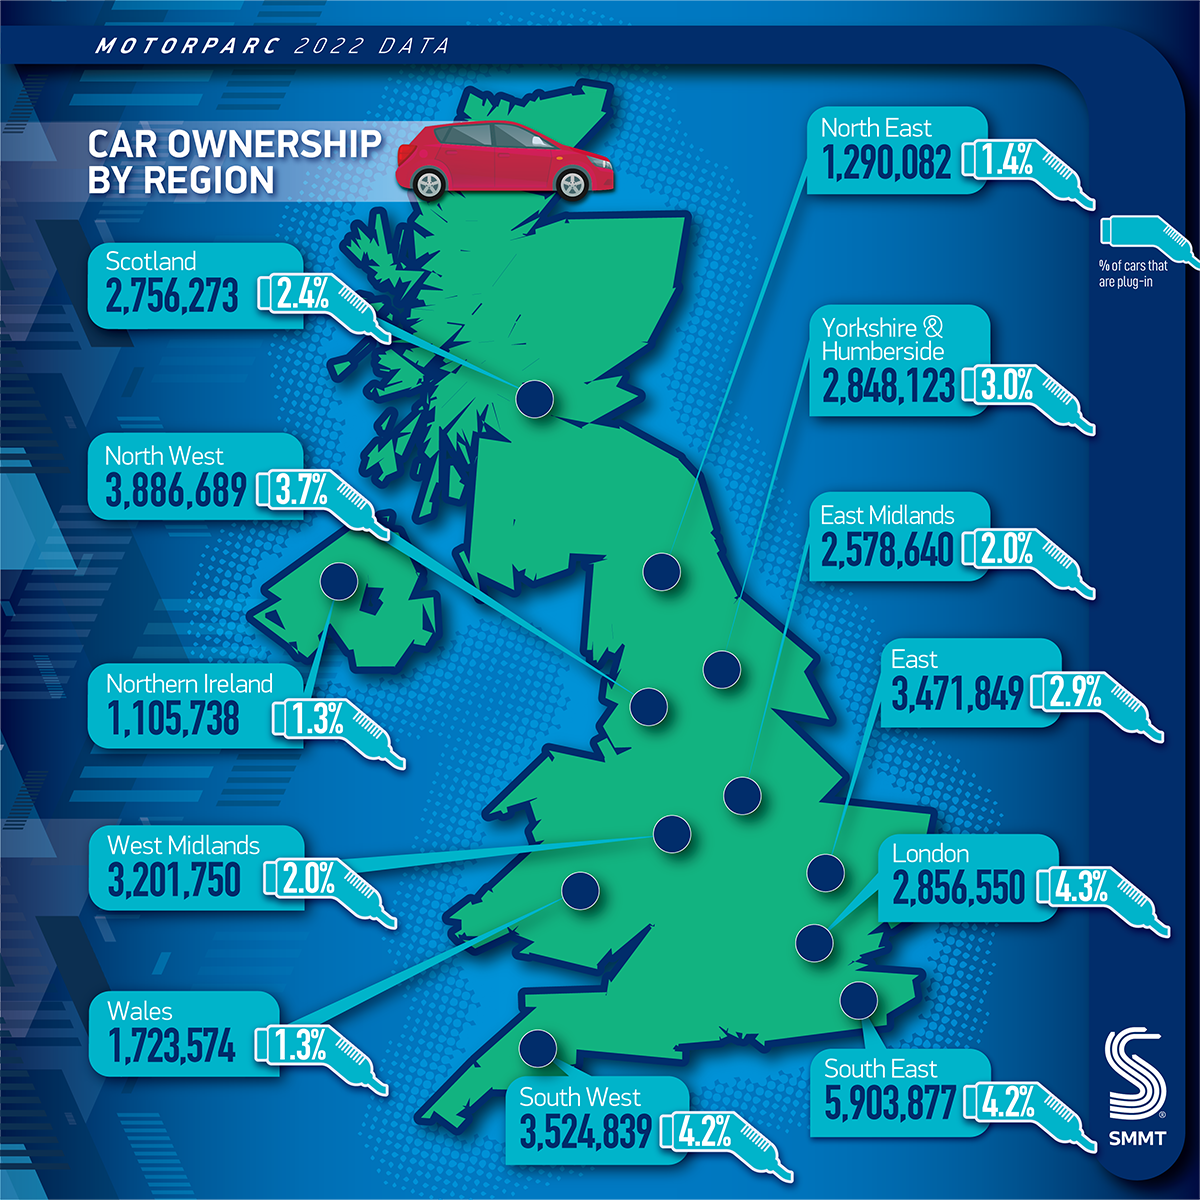
More Britons are getting back into the driving seat following the pandemic, according to new annual Motorparc data from the Society of Motor Manufacturers and Traders (SMMT), with the number of cars in use on UK roads in 2022 rising by 124,393 units to a total of 35,148,045. This has returned the number of cars on the road to levels last seen in 20191, while the overall number of vehicles has risen to a record 40,723,974 units as supply shortages begin to ease and scrappage levels decline.
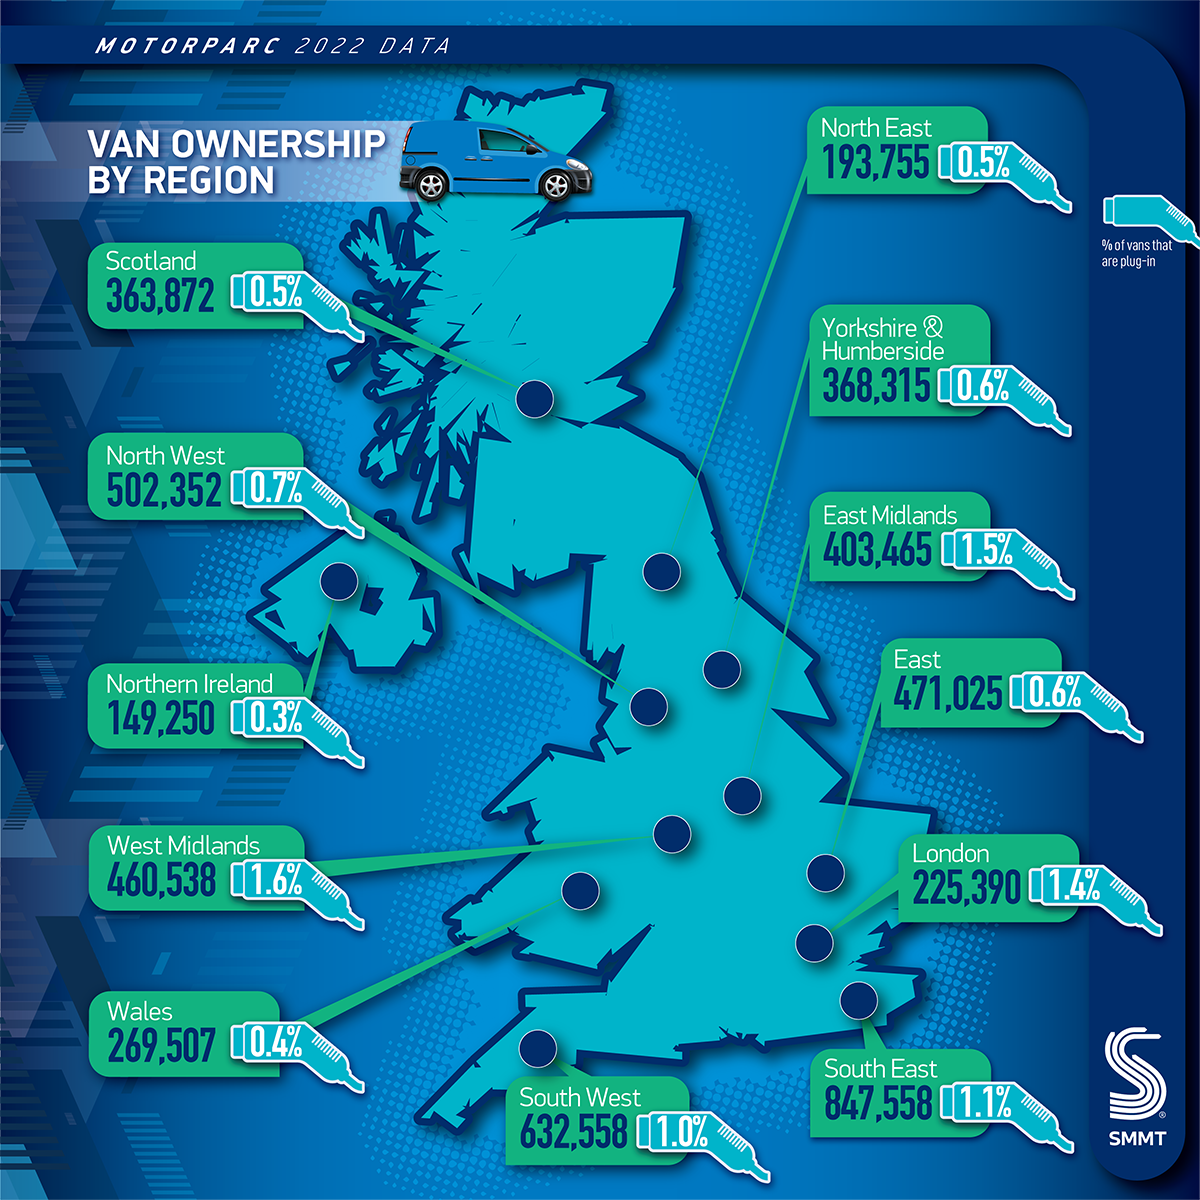
Businesses are also getting into gear to help deliver the UK’s post-pandemic recovery, with 615,570 trucks and 4,887,593 vans in service, up 1.9% and 1.7% respectively. Britain’s HGV parc is now at record levels, while vans make up almost one in eight vehicles in use, the largest proportion ever recorded.
The UK’s bus and coach fleet, however, has fallen again, by -2.3% to 72,766 vehicles – the lowest since records began, with 16,608 going out of service over the last decade.2 More than one in four buses have been in use for more than 15 years3, demonstrating the need for support to encourage operators to invest in the latest zero-emission buses given the essential role these vehicles play in providing mobility for millions of people and in road transport decarbonisation.
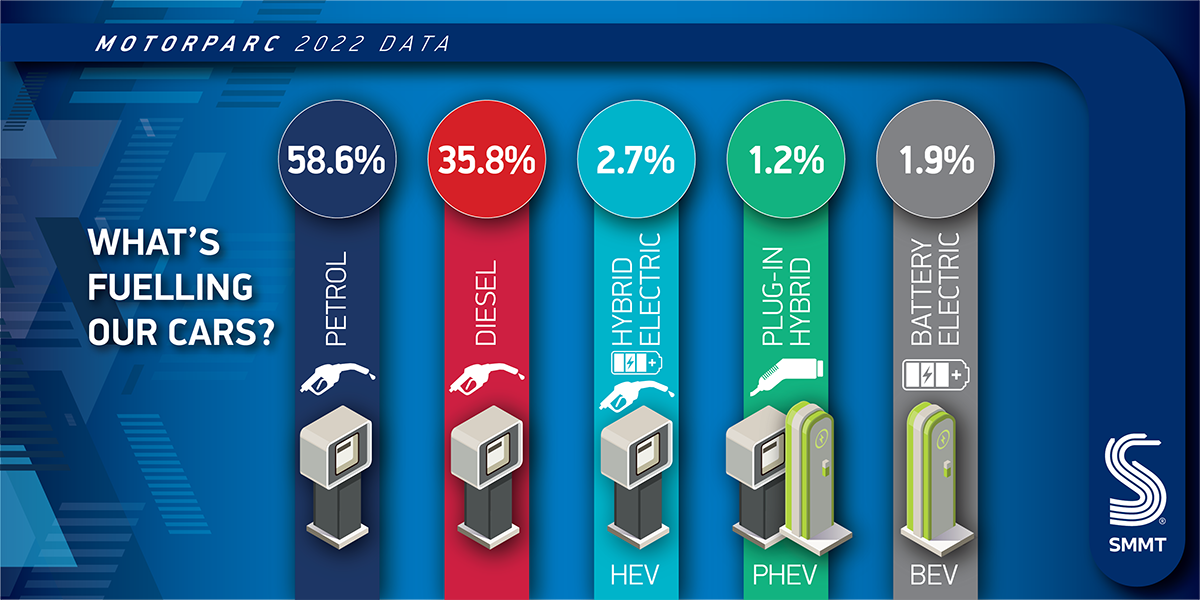
Despite the overall increase in vehicles on the road, average car and van CO2 emissions have fallen by -1.6% – driven by the influx of new lower and zero emission models. One in 32 cars driving in Britain now comes with a plug, amounting to 1,089,241 vehicles – a rise of more than half over the last year, to reach 3.1% of the parc4.
Ownership of electric commercial vehicles has also risen, with vans up some 67.3% and buses and coaches increasing by 34.9%, while the number of zero emission trucks has almost trebled since last year – although they still account for fewer than one in 600 in use. As a result, Britain is benefiting from a growth in vehicle numbers without compromising on the environment.
However, public chargepoint rollout continues to lag behind EV uptake, with one standard public charger for every 36 plug-in cars on the road, down from 31 in 2021.5 The need for investment is even more intense for other road transport sectors, however, as these existing chargepoints may not be suitably located or sized to serve van operators, and there are no dedicated HGV charging points on the UK’s strategic road network at all. Deployment of infrastructure appropriate for commercial vehicles would energise uptake of the latest electric vehicles, accelerate fleet renewal to take older units off the road, and help reduce the UK’s carbon footprint.
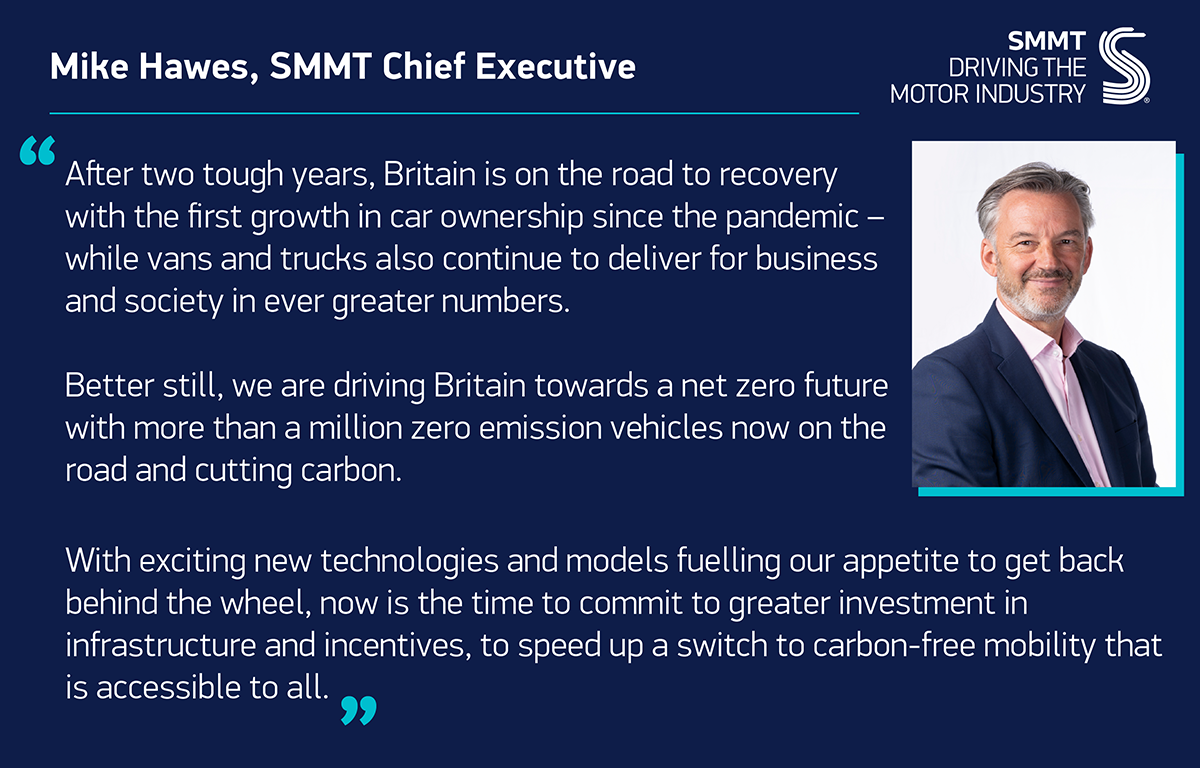
Mike Hawes, SMMT Chief Executive, said,
After two tough years, Britain is on the road to recovery with the first growth in car ownership since the pandemic – while vans and trucks also continue to deliver for business and society in ever greater numbers. Better still, we are driving Britain towards a net zero future with more than a million zero emission vehicles now on the road and cutting carbon. With exciting new technologies and models fuelling our appetite to get back behind the wheel, now is the time to commit to greater investment in infrastructure and incentives, to speed up a switch to carbon-free mobility that is accessible to all.
Did you know?
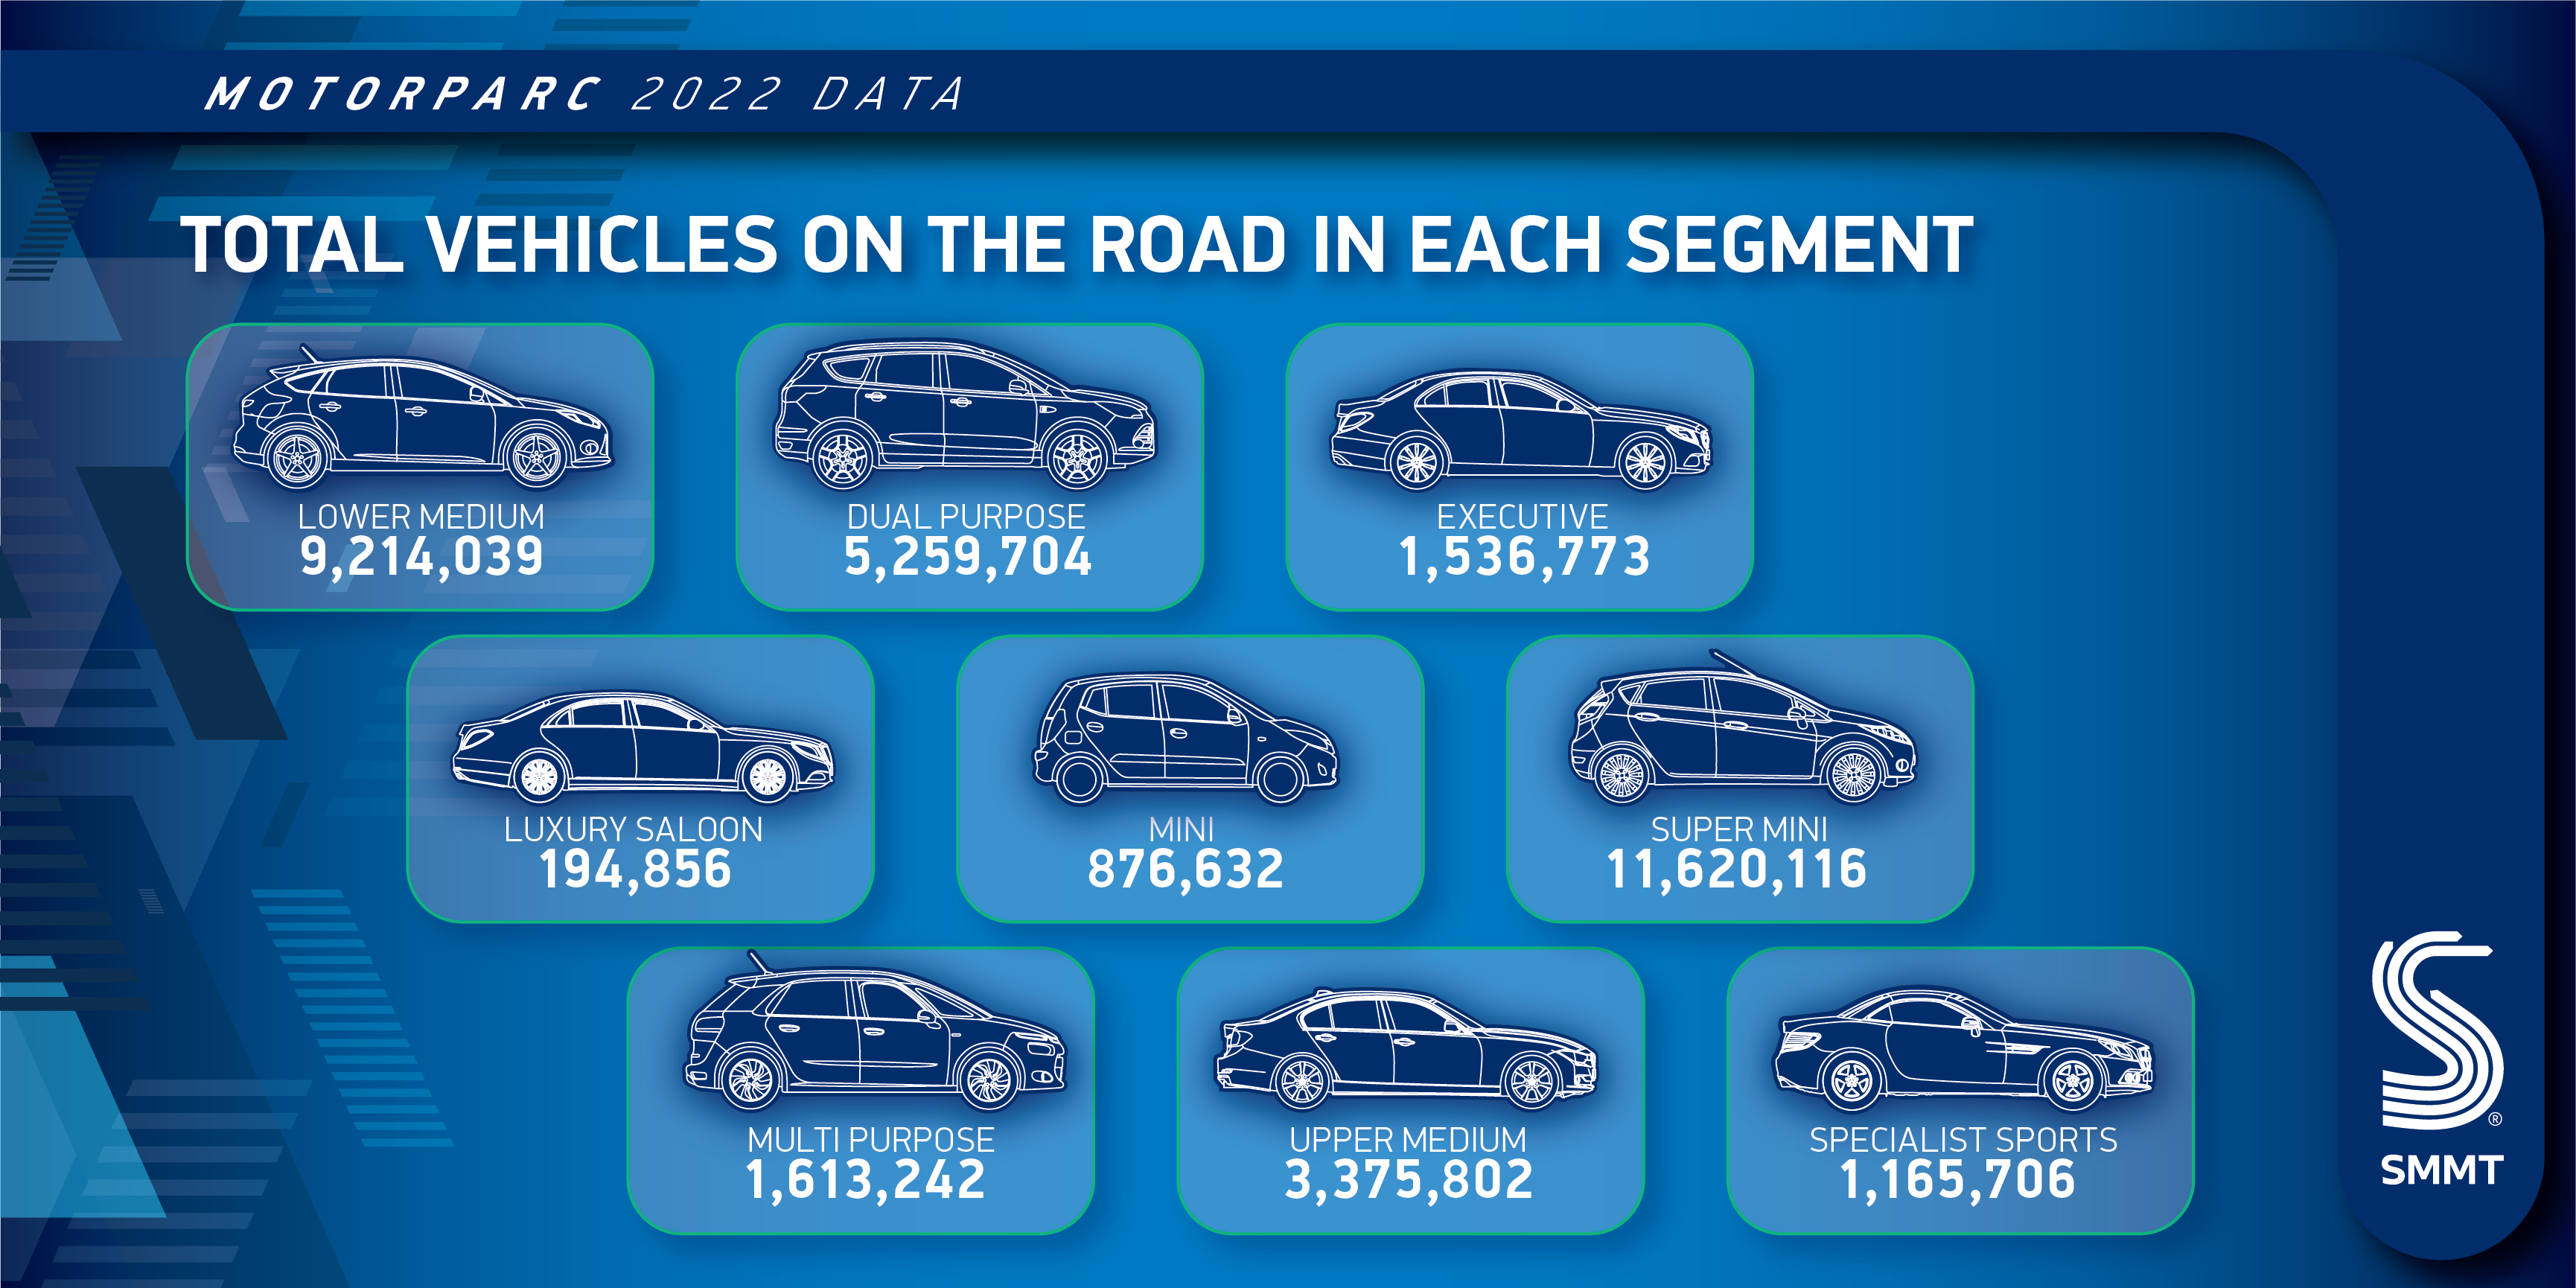
- The UK’s most popular cars are superminis and small family (lower medium) models, which account for nearly six in 10 cars in service, at 11,620,116 and 9,214,039 units respectively.
- Two in three cars in use are manual transmission.
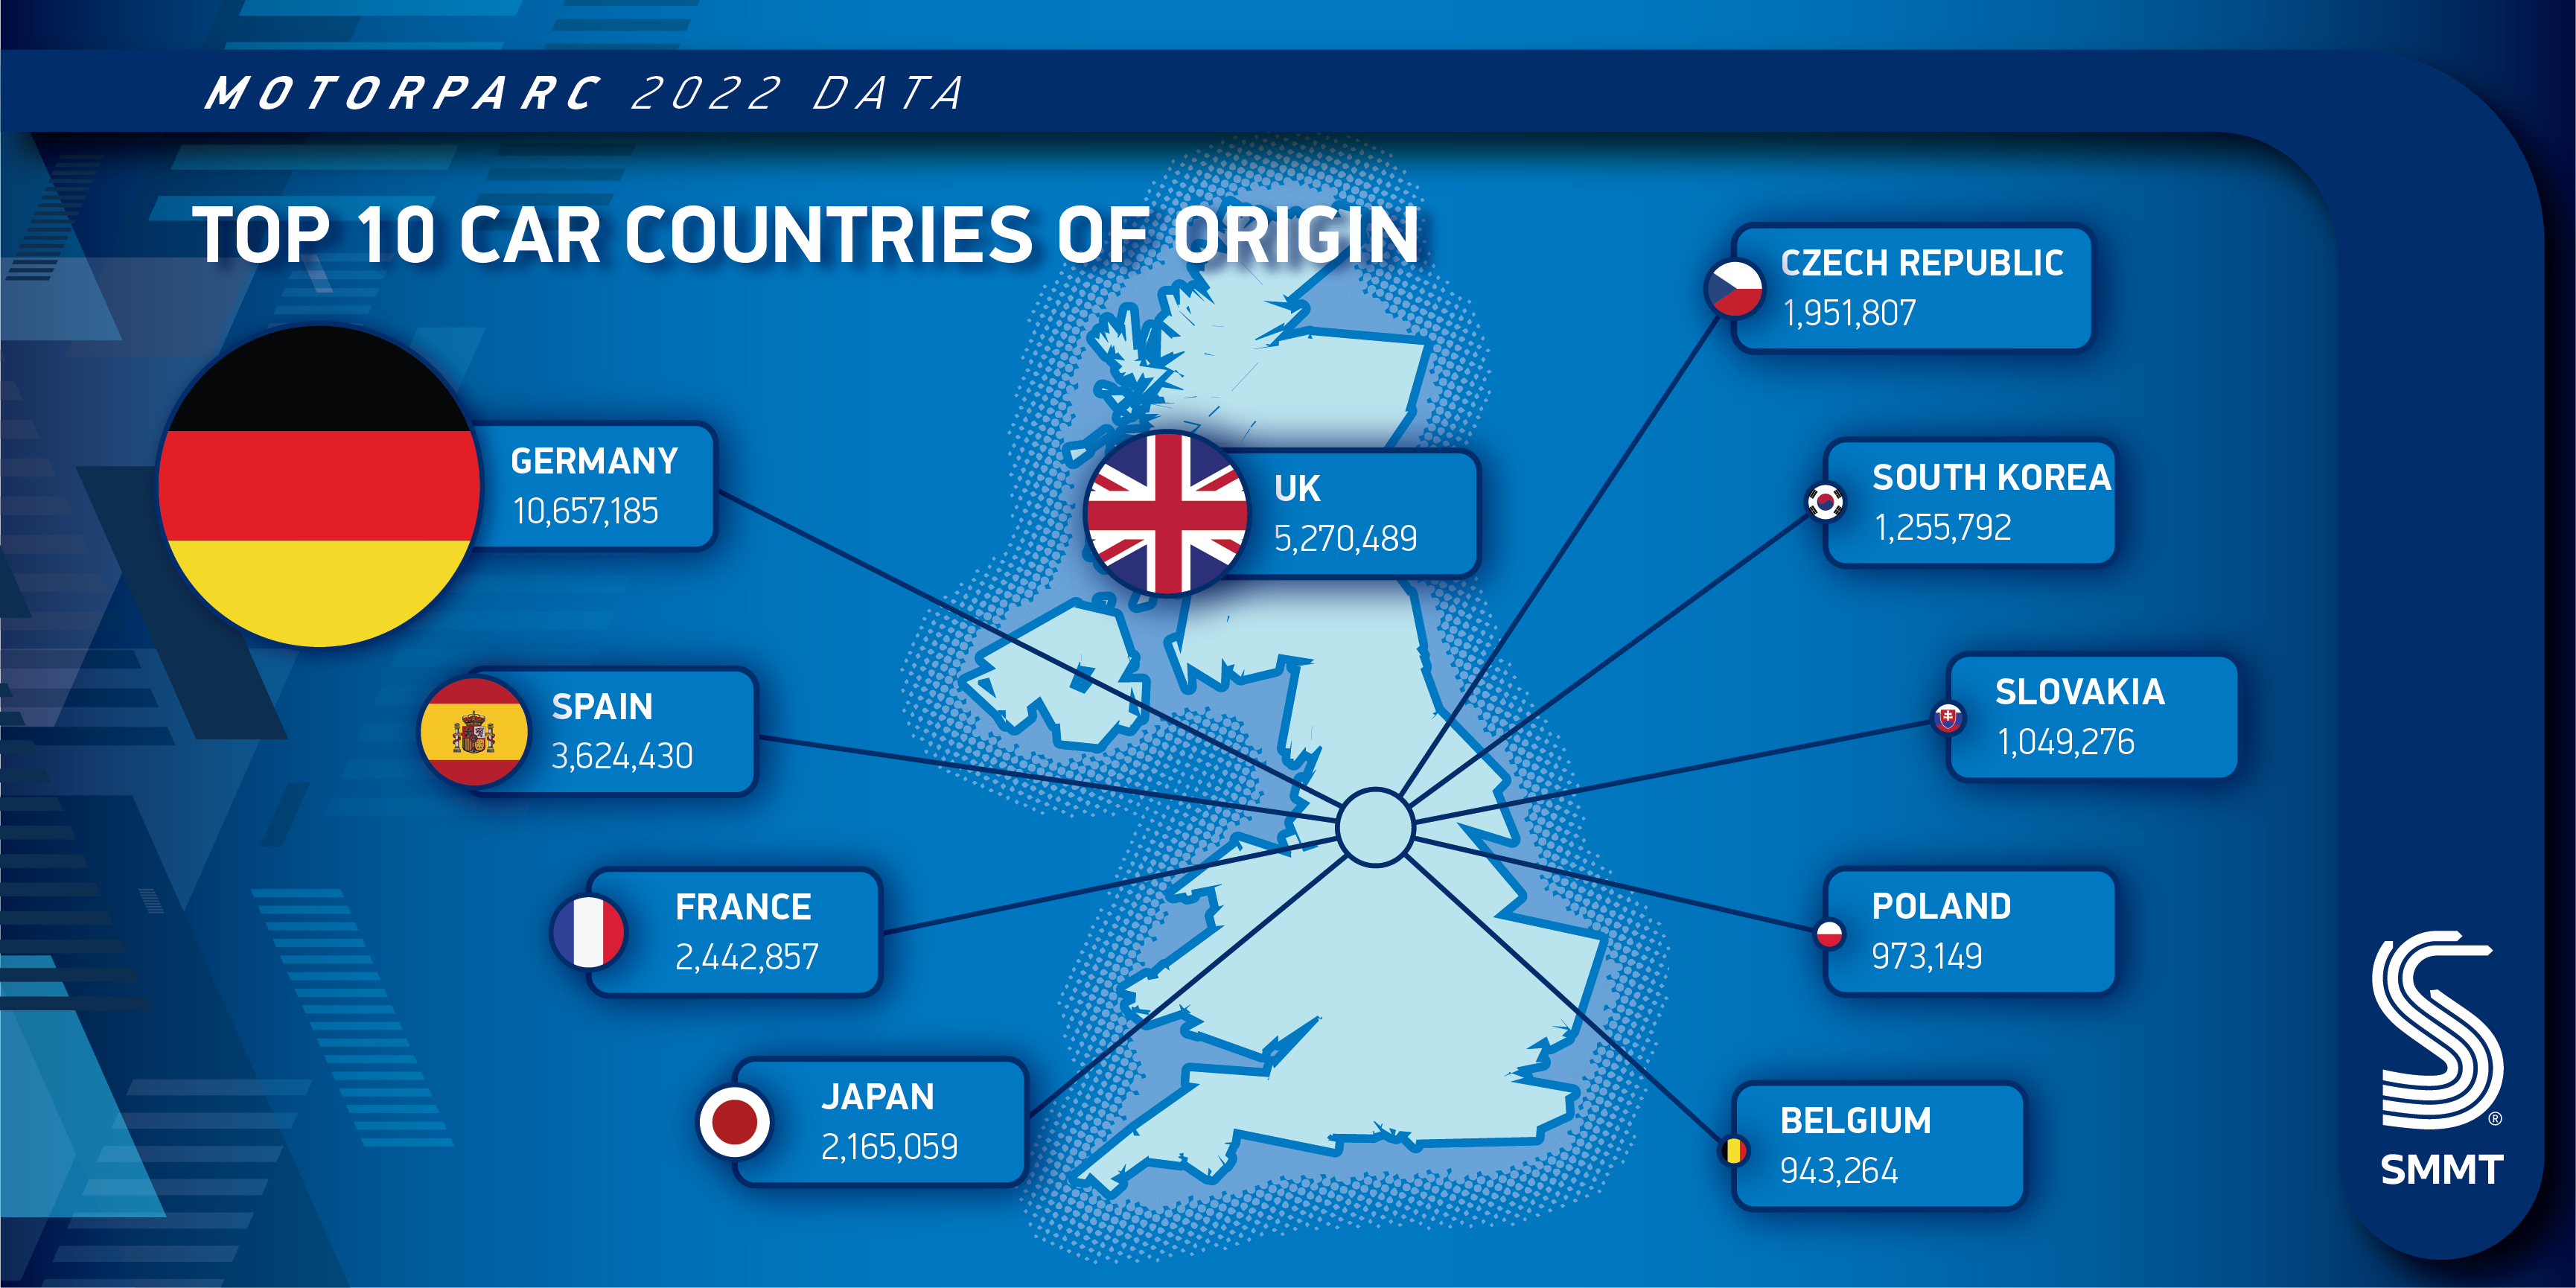
- 67.2% of cars driven in the UK were made in the EU, while 15.0% were built in Britain.
- Female car ownership has risen by 0.2% to 12,414,260 units, while male car ownership has fallen -0.3% to 18,070,718. 4,663,067 cars are registered to companies or have no gender information recorded.
- More buses are in use in London (10,534) than the whole of the West Midlands (5,177) and East Midlands combined (5,027).
- One in five electric vans are registered in the South East.
- The East of England is Britain’s zero emission haulage hotbed, with 306 battery electric trucks registered in the region.
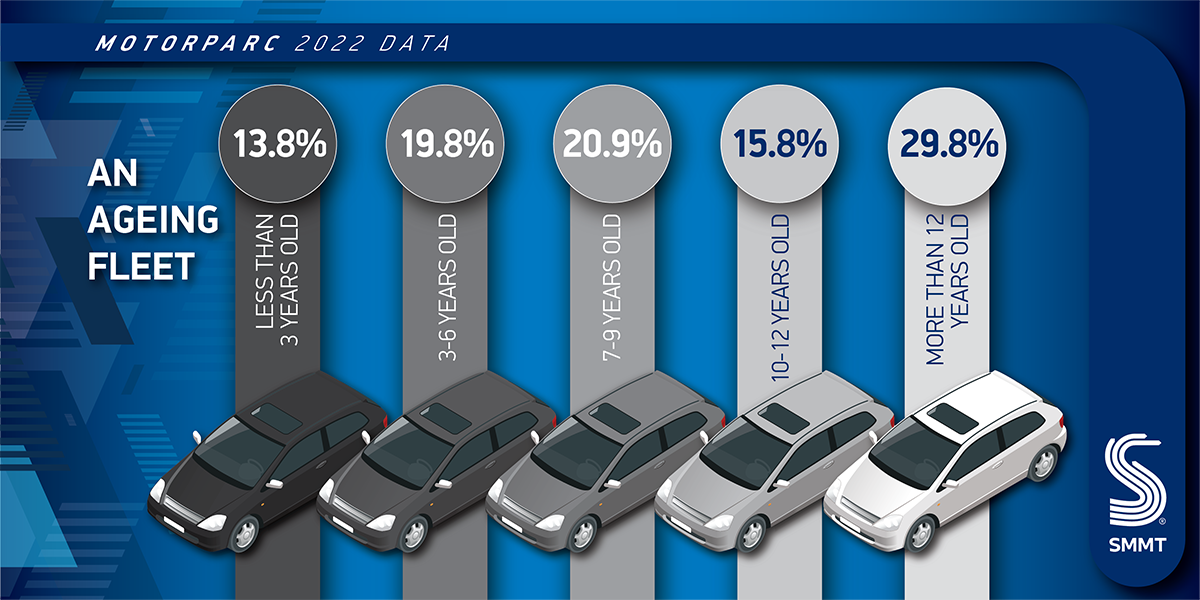
- The average car and van on the road are both 9.0 years old, while the average truck has seen 8.2 years of service. The average bus, however, has been transporting passengers for 13.1 years.
- British-built vehicles are the most popular in the heavy vehicle sector. 28.1% of trucks and 42.1% of buses currently in use were built in the UK.
Notes to editors
1 Motorparc 2019: Cars – 35,168,259
2 Motorparc 2013: Buses – 89,374
3 Buses first registered 2007 or earlier: 20,970
4 Battery electric cars: 652,341; plug-in hybrid cars: 436,900
5 DfT Electric vehicle charging device statistics, Jan 2023: 30,168 slow/fast chargers; total plug-in cars: 1,089,241
File Downloads
- Motorparc 2022
Motorparc 2022
| Title | Description | Version | Size | Download |
|---|---|---|---|---|
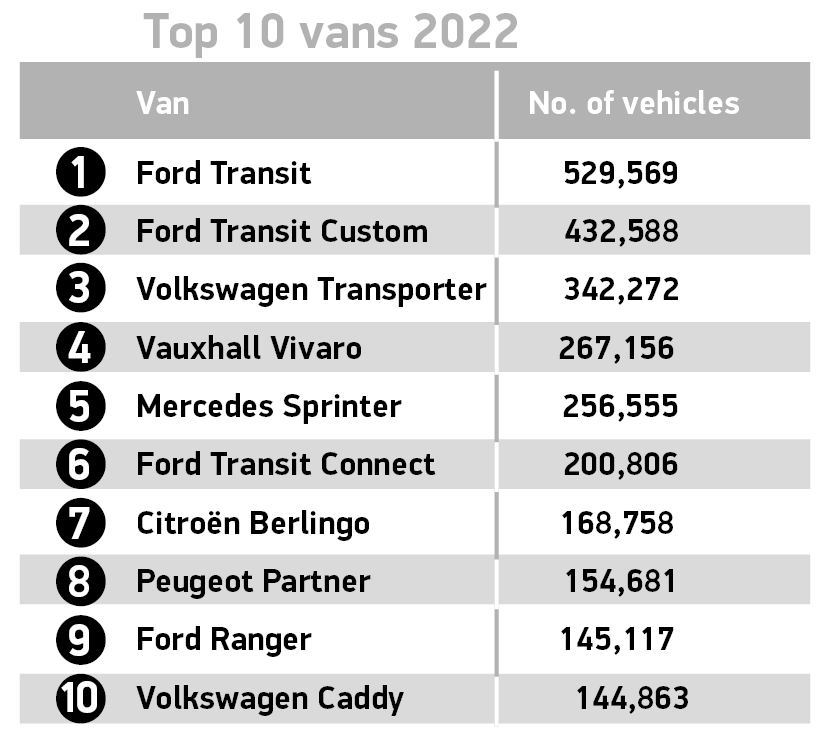
| Top 10 vans 2022 | 137.84 KB | DownloadPreview | ||
| Top 10 vans 2022 | 59.90 KB | DownloadPreview | ||
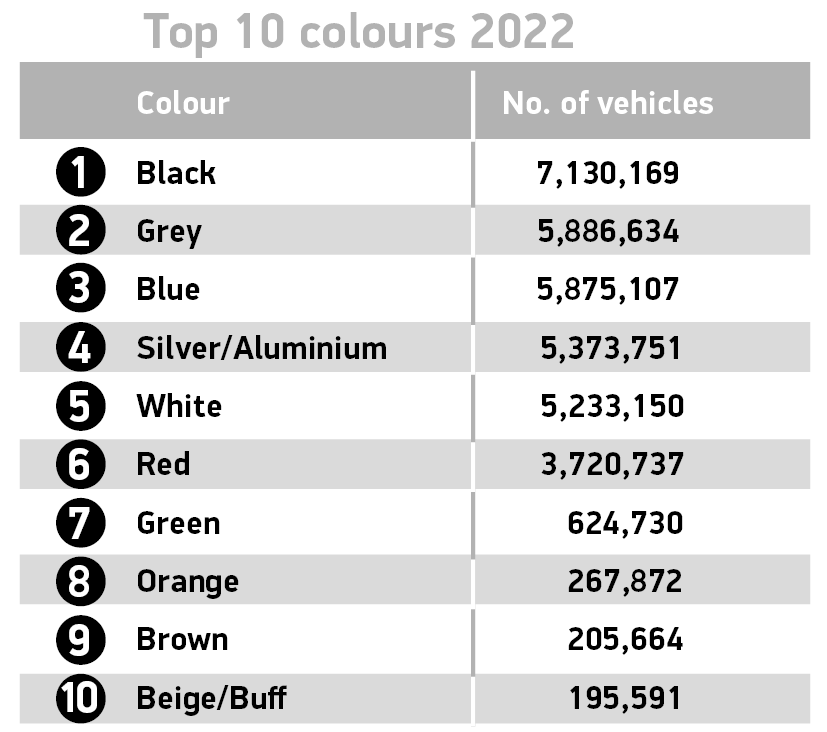
| Top 10 colours 2022 | 48.21 KB | DownloadPreview | ||
| Top 10 colours 2022 | 48.35 KB | DownloadPreview | ||
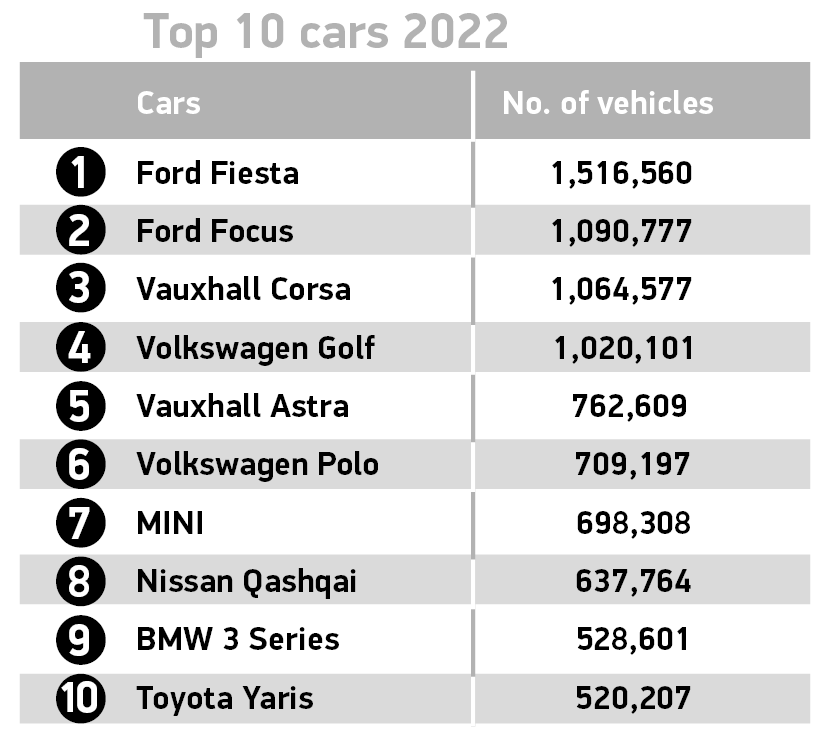
| Top 10 cars 2022 | 128.38 KB | DownloadPreview | ||
| Top 10 cars 2022 | 56.03 KB | DownloadPreview | ||
| SMMT News Release – Britain gets back into the driving seat with more than a million EVs on the road | 4.36 MB | Download | ||
| Motorparc vans by region 2022 | 1.00 MB | DownloadPreview | ||
| Motorparc car segments 2022 | 1.36 MB | DownloadPreview | ||
| Motorparc cars by region 2022 | 1.00 MB | DownloadPreview | ||
| Motorparc car fuel types 2022 | 366.87 KB | DownloadPreview | ||
| Motorparc car countries of origin 2022 | 1.20 MB | DownloadPreview | ||
| Motorparc car average ages 2022 | 453.60 KB | DownloadPreview | ||
| Motorparc by vehicle type 2022 | 496.42 KB | DownloadPreview | ||
| MH motorparc quote | 452.27 KB | DownloadPreview |
One Comment

[…] As someone who’s always been a bit of a car enthusiast, I’ve read extensively about EVs and kept an eye on the industry’s advancements. I’m no stranger to the appeal of electric cars, especially in the UK, where their adoption is rapidly increasing. According to the new annual Motorparc data from the SMMT (Society of Motor Manufacturers and Traders) there are more than a million EVs on the road. […]